

sain t-gobain annu al report 2008 annual report
sain t-gobain annu al report 2008 annual report
sain t-gobain annu al report 2008 annual report

Create successful ePaper yourself
Turn your PDF publications into a flip-book with our unique Google optimized e-Paper software.
KEY FIGURES<br />
<strong>2008</strong>: a satisfactory year<br />
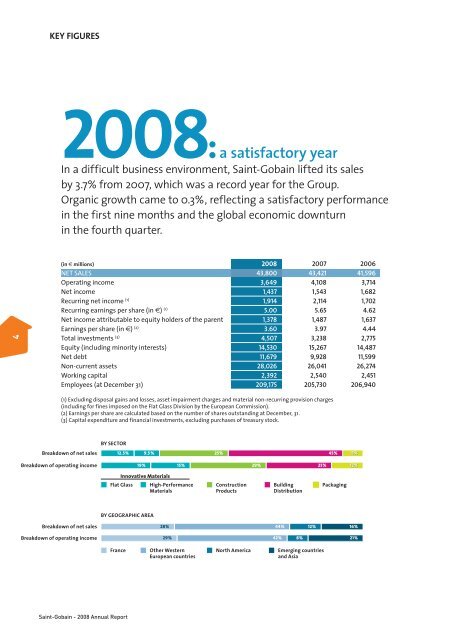
In a difficult business environment, Saint-Gobain lifted its s<strong>al</strong>es<br />
by 3.7% from 2007, which was a record year for the Group.<br />
Organic growth came to 0.3%, reflecting a satisfactory performance<br />
in the first nine months and the glob<strong>al</strong> economic downturn<br />
in the fourth quarter.<br />
4<br />
(in € millions) <strong>2008</strong> 2007 2006<br />
NET SALES 43,800 43,421 41,596<br />
Operating income 3,649 4,108 3,714<br />
Net income 1,437 1,543 1,682<br />
Recurring net income (1) 1,914 2,114 1,702<br />
Recurring earnings per share (in €) (1) 5.00 5.65 4.62<br />
Net income attributable to equity holders of the parent 1,378 1,487 1,637<br />
Earnings per share (in €) (2) 3.60 3.97 4.44<br />
Tot<strong>al</strong> investments (3) 4,507 3,238 2,775<br />
Equity (including minority interests) 14,530 15,267 14,487<br />
Net debt 11,679 9,928 11,599<br />
Non-current assets 28,026 26,041 26,274<br />
Working capit<strong>al</strong> 2,392 2,540 2,451<br />
Employees (at December 31) 209,175 205,730 206,940<br />
(1) Excluding dispos<strong>al</strong> gains and losses, asset impairment charges and materi<strong>al</strong> non-recurring provision charges<br />
(including for fines imposed on the Flat Glass Division by the European Commission).<br />
(2) Earnings per share are c<strong>al</strong>culated based on the number of shares outstanding at December, 31.<br />
(3) Capit<strong>al</strong> expenditure and financi<strong>al</strong> investments, excluding purchases of treasury stock.<br />
Breakdown of net s<strong>al</strong>es<br />
Breakdown of operating income<br />
BY SECTOR<br />
12.5% 9.5 % 25 % 45 % 8 %<br />
19% 15 %<br />
29 %<br />
25%<br />
12%<br />
Innovative Materi<strong>al</strong>s<br />
Flat Glass<br />
High-Performance<br />
Materi<strong>al</strong>s<br />
Construction<br />
Products<br />
Building<br />
Distribution<br />
Packaging<br />
BY GEOGRAPHIC AREA<br />
Breakdown of net s<strong>al</strong>es<br />
Breakdown of operating income<br />
28% 44% 12% 16%<br />
29% 42% 8% 21%<br />
France<br />
Other Western<br />
European countries<br />
North America<br />
Emerging countries<br />
and Asia<br />
Saint-Gobain - <strong>2008</strong> Annu<strong>al</strong> Report


