Create successful ePaper yourself
Turn your PDF publications into a flip-book with our unique Google optimized e-Paper software.
each Supersector are eligible for inclusion in the index. Any<br />
remaining constituents in the lowest 20% by investable<br />
market capitalisation are excluded. This process is repeated<br />
for each of the Supersectors. Finally, Supersectors are<br />
combined to form the Regional or Country <strong>FTSE</strong> ISS<br />
Corporate Governance <strong>Index</strong>.<br />
This review procedure inevitably narrows the number of<br />
constituents in the <strong>FTSE</strong> ISS Developed CGI universe to<br />
1,350 constituents, down from the original 2,089<br />
constituents. In comparison, the <strong>FTSE</strong> ISS UK CG <strong>Index</strong> is<br />
focused on some 315 constituents (compared with the 578<br />
in the <strong>FTSE</strong> All-Share <strong>Index</strong> universe).<br />
During the market consultation exercise <strong>FTSE</strong> assessed<br />
various different methods of producing an appropriate<br />
index series that accurately reflected the corporate<br />
governance performance of the world’s listed companies.<br />
Three choices of methodology were available to the index<br />
design team. They could adopt an exclusion policy or they<br />
could retain all the traditional index constituents, but<br />
overweight companies with good corporate governance<br />
performance and underweight the poorer performers.<br />
Alternately, they could produce best and worst in class<br />
indices with a limited number of stocks.<br />
Before a decision was taken, each of the options was<br />
thoroughly investigated. Difficulties became obvious very<br />
quickly. The overweight versus underweight methodology, for<br />
instance, did not give major differences to the exclusion policy.<br />
The reason was simple. Removing a proportion of stocks is<br />
just another way of radically underweighting them, which<br />
then will automatically overweight the remainder. Any<br />
resulting performance would therefore be more reliant upon<br />
the particular mix of stocks that are included (or excluded)<br />
from the index. This mix relates to both relative market<br />
capitalisation sizes and then individual stock performance.<br />
The other issue on exclusion is that of turnover. The more<br />
constituents that are excluded from the index the higher the<br />
turnover can potentially be. This has an influence on<br />
deciding what level of market capitalisation could be<br />
excluded from the index. Removing a large amount of<br />
market capitalisation may have more influence on<br />
performance but would theoretically lead to higher turnover.<br />
Removing less than 20% would not have had a sufficiently<br />
<strong>FTSE</strong> GLOBAL MARKETS • JULY/AUGUST 2005<br />
useful effect, but removing more would begin to have<br />
implications for turnover. Having looked at this issue it was<br />
clear that an 80/20 split gave the right balance between<br />
inclusion and exclusion.<br />
Indeed it is this last point that ensured that at least in<br />
these early stages our third option of producing the “best”<br />
and worst”indexes could potentially lead to high turnover.<br />
In the end, the team opted for an exclusion<br />
methodology. The majority of participants in the market<br />
consultations process had suggested that for the first<br />
phase of the Corporate Governance Indices, investors<br />
were most interested in an index where constituents<br />
that tended towards poor corporate governance practices<br />
were excluded.<br />
Exclusion Performance<br />
The <strong>FTSE</strong> ISS CGI <strong>Series</strong> aims to track its underlying<br />
benchmark indices very closely. This is helped by its sector<br />
neutral approach and by removing only 20% of the<br />
underlying market capitalisation at review.<br />
As a result of using this methodology, we would expect<br />
similar historical correlations and performance as the<br />
underlying benchmarks. The main issue with looking at<br />
historical performance is determining constituent changes<br />
in corporate governance practices.<br />
<strong>FTSE</strong> used FactSet software to run a series of backcast<br />
index values to highlight any performance differences. The<br />
backcasts are based on a current set of constituents for each<br />
index and are calculated backwards for a period of five<br />
years. As this methodology does not take into account<br />
constituent changes throughout time the same<br />
methodology was applied to the relative underlying<br />
benchmarks to remove any calculation biases.<br />
The analysis is mixed as to whether corporate<br />
governance has an overriding effect on company<br />
performance. Equally, the evidence of a clear link between<br />
corporate governance standards and share price<br />
performance is mixed. The <strong>FTSE</strong> ISS UK CGI outperforms<br />
its equivalent <strong>FTSE</strong> index over one and three years, and the<br />
<strong>FTSE</strong> ISS Developed CGI, <strong>FTSE</strong> ISS Japan CGI, and <strong>FTSE</strong><br />
ISS US CGI outperforms over a five-year period. The <strong>FTSE</strong><br />
ISS Europe and Euro CGIs underperform their respective<br />
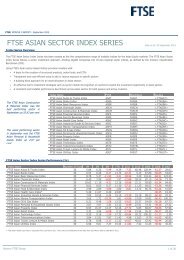
Table 1: <strong>FTSE</strong> ISS Corporate Governance Indices versus their respective benchmarks<br />
CG <strong>Index</strong> Stocks Net Market Net Market Benchmark <strong>Index</strong> Stocks Net Market Net Market<br />
Cap Cap (Local Cap Cap (Local<br />
(USD Bn) Curr. Bn) (USD Bn) Curr. Bn)<br />
<strong>FTSE</strong> ISS US CG <strong>Index</strong> 412 9,048 9,048 <strong>FTSE</strong> US <strong>Index</strong>* 743 12,216 12,216<br />
<strong>FTSE</strong> ISS UK CG <strong>Index</strong> 315 2,176 1,140 <strong>FTSE</strong> All-Share <strong>Index</strong>* 578 2,713 1,421<br />
<strong>FTSE</strong> ISS Japan CG <strong>Index</strong> 353 1,647 172,988 <strong>FTSE</strong> Japan <strong>Index</strong>* 479 2,077 218,217<br />
<strong>FTSE</strong> ISS Developed CG <strong>Index</strong> 1,350 17,600 17,600 <strong>FTSE</strong> Developed <strong>Index</strong>* 2,089 22,828 22,828<br />
<strong>FTSE</strong> ISS Europe CG <strong>Index</strong> 347 5,590 4,259 <strong>FTSE</strong> Developed Europe <strong>Index</strong>* 502 6,985 5,321<br />
<strong>FTSE</strong> ISS Euro CG <strong>Index</strong> 194 2,892 2,203 <strong>FTSE</strong> Eurozone <strong>Index</strong>* 277 3,516 2,678<br />
*Excludes Investment Companies Data as at 3rd March 2005<br />
83