

digital compensation of dynamic acquisition errors at the front-end of ...
digital compensation of dynamic acquisition errors at the front-end of ...
digital compensation of dynamic acquisition errors at the front-end of ...

Create successful ePaper yourself
Turn your PDF publications into a flip-book with our unique Google optimized e-Paper software.
20 Chapter 2: Nonlinearity <strong>at</strong> <strong>the</strong> ADC’s Front-End<br />
Devi<strong>at</strong>ion from <strong>the</strong> straight line (Q)<br />
6<br />
4<br />
2<br />
0<br />
-2<br />
-4<br />
0 0.2 0.4 0.6 0.8 1<br />
8 x V in<br />
(V)<br />
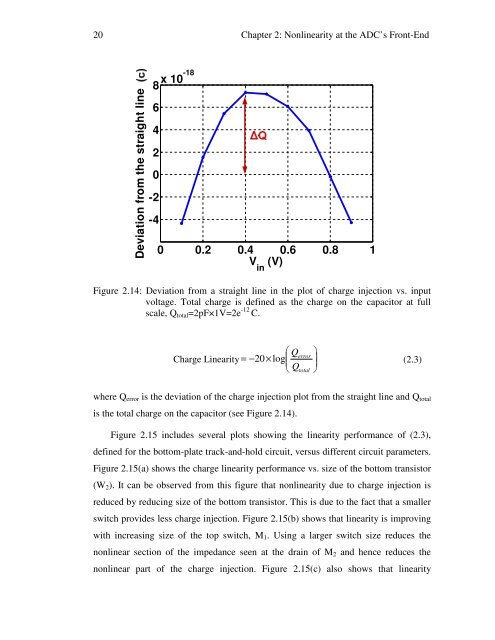
Figure 2.14: Devi<strong>at</strong>ion from a straight line in <strong>the</strong> plot <strong>of</strong> charge injection vs. input<br />
voltage. Total charge is defined as <strong>the</strong> charge on <strong>the</strong> capacitor <strong>at</strong> full<br />
scale, Q total =2pF×1V=2e -12 C.<br />
⎛ Q<br />
Charge Linearity<br />
⎟ ⎞<br />
error<br />
= −20 × log<br />
⎜<br />
(2.3)<br />
⎝ Qtotal<br />
⎠<br />
where Q error is <strong>the</strong> devi<strong>at</strong>ion <strong>of</strong> <strong>the</strong> charge injection plot from <strong>the</strong> straight line and Q total<br />
is <strong>the</strong> total charge on <strong>the</strong> capacitor (see Figure 2.14).<br />
Figure 2.15 includes several plots showing <strong>the</strong> linearity performance <strong>of</strong> (2.3),<br />
defined for <strong>the</strong> bottom-pl<strong>at</strong>e track-and-hold circuit, versus different circuit parameters.<br />
Figure 2.15(a) shows <strong>the</strong> charge linearity performance vs. size <strong>of</strong> <strong>the</strong> bottom transistor<br />
(W 2 ). It can be observed from this figure th<strong>at</strong> nonlinearity due to charge injection is<br />
reduced by reducing size <strong>of</strong> <strong>the</strong> bottom transistor. This is due to <strong>the</strong> fact th<strong>at</strong> a smaller<br />
switch provides less charge injection. Figure 2.15(b) shows th<strong>at</strong> linearity is improving<br />
with increasing size <strong>of</strong> <strong>the</strong> top switch, M 1 . Using a larger switch size reduces <strong>the</strong><br />
nonlinear section <strong>of</strong> <strong>the</strong> impedance seen <strong>at</strong> <strong>the</strong> drain <strong>of</strong> M 2 and hence reduces <strong>the</strong><br />
nonlinear part <strong>of</strong> <strong>the</strong> charge injection. Figure 2.15(c) also shows th<strong>at</strong> linearity


