- Page 2 and 3:
This page intentionally left blank.
- Page 4 and 5:
Copyright Notice Reproduction of th
- Page 6 and 7:
Sonnet User’s Guide Via Loss. . .
- Page 8 and 9:
Sonnet User’s Guide 9 ADAPTIVE BA
- Page 10 and 11:
Sonnet User’s Guide Good and Bad
- Page 12 and 13:
Sonnet User’s Guide Probing the P
- Page 14 and 15:
Sonnet User’s Guide 14
- Page 16 and 17:
Sonnet User’s Guide Project Edito
- Page 18 and 19:
Sonnet User’s Guide lumped elemen
- Page 20 and 21:
Sonnet User’s Guide Em performs e
- Page 22 and 23:
Sonnet User’s Guide Zero Voltage
- Page 24 and 25:
Sonnet User’s Guide New Features
- Page 26 and 27:
Sonnet User’s Guide Multiconducto
- Page 28 and 29:
Sonnet User’s Guide parameter is
- Page 30 and 31:
Sonnet User’s Guide do not need t
- Page 32 and 33:
Sonnet User’s Guide For example,
- Page 34 and 35:
Sonnet User’s Guide Subsectioning
- Page 36 and 37:
Sonnet User’s Guide Subsection si
- Page 38 and 39:
Sonnet User’s Guide 1 Cell Wide (
- Page 40 and 41:
Sonnet User’s Guide When used in
- Page 42 and 43:
Sonnet User’s Guide There are thr
- Page 44 and 45:
Sonnet User’s Guide Setting this
- Page 46 and 47:
Sonnet User’s Guide Conformal Mes
- Page 48 and 49:
Sonnet User’s Guide A common misc
- Page 50 and 51:
Sonnet User’s Guide the conductor
- Page 52 and 53:
Sonnet User’s Guide Rdc/Rrf This
- Page 54 and 55:
Sonnet User’s Guide There are thr
- Page 56 and 57:
Sonnet User’s Guide Metal Librari
- Page 58 and 59:
Sonnet User’s Guide Dielectric La
- Page 60 and 61:
Sonnet User’s Guide The global li
- Page 62 and 63:
Sonnet User’s Guide • Reference
- Page 64 and 65:
Sonnet User’s Guide the capacitiv
- Page 66 and 67:
Sonnet User’s Guide many uses, in
- Page 68 and 69:
Sonnet User’s Guide Normally, if
- Page 70 and 71:
Sonnet User’s Guide For a box wal
- Page 72 and 73:
Sonnet User’s Guide ground for th
- Page 74 and 75:
Sonnet User’s Guide User Defined:
- Page 76 and 77:
Sonnet User’s Guide In most cases
- Page 78 and 79:
Sonnet User’s Guide em does force
- Page 80 and 81:
Sonnet User’s Guide 80
- Page 82 and 83:
Sonnet User’s Guide In cases wher
- Page 84 and 85:
Sonnet User’s Guide Physical Size
- Page 86 and 87:
Sonnet User’s Guide • The type
- Page 88 and 89:
Sonnet User’s Guide Polygon Edge(
- Page 90 and 91:
Sonnet User’s Guide When you sele
- Page 92 and 93:
Sonnet User’s Guide Physical Size
- Page 94 and 95:
Sonnet User’s Guide 3. Nearby obj
- Page 96 and 97:
Sonnet User’s Guide 96
- Page 98 and 99:
Sonnet User’s Guide Metal Box Wal
- Page 100 and 101:
Sonnet User’s Guide As em perform
- Page 102 and 103:
Sonnet User’s Guide S-Parameters
- Page 104 and 105:
Sonnet User’s Guide When de-embed
- Page 106 and 107:
Sonnet User’s Guide You should no
- Page 108 and 109:
Sonnet User’s Guide contains a re
- Page 110 and 111:
Sonnet User’s Guide Reference Pla
- Page 112 and 113:
Sonnet User’s Guide moves” a le
- Page 114 and 115:
Sonnet User’s Guide same is true
- Page 116 and 117:
Sonnet User’s Guide Em dedicates
- Page 118 and 119:
Sonnet User’s Guide 5 Click on th
- Page 120 and 121:
Sonnet User’s Guide Another way t
- Page 122 and 123:
Sonnet User’s Guide reaches a max
- Page 124 and 125:
Sonnet User’s Guide 5 Enter the f
- Page 126 and 127:
Sonnet User’s Guide If you wish t
- Page 128 and 129:
Sonnet User’s Guide 128
- Page 130 and 131:
Sonnet User’s Guide within a user
- Page 132 and 133:
Sonnet User’s Guide When you sele
- Page 134 and 135:
Sonnet User’s Guide fine another
- Page 136 and 137:
Sonnet User’s Guide An example of
- Page 138 and 139:
Sonnet User’s Guide • You selec
- Page 140 and 141:
Sonnet User’s Guide the two refer
- Page 142 and 143:
Sonnet User’s Guide Moving Adjust
- Page 144 and 145:
Sonnet User’s Guide when the valu
- Page 146 and 147:
Sonnet User’s Guide Reference Pla
- Page 148 and 149:
Sonnet User’s Guide If the projec
- Page 150 and 151:
Sonnet User’s Guide In the case o
- Page 152 and 153:
Sonnet User’s Guide The equations
- Page 154 and 155:
Sonnet User’s Guide Once the opti
- Page 156 and 157:
Sonnet User’s Guide This is an ex
- Page 158 and 159:
Sonnet User’s Guide 6 Drag the mo
- Page 160 and 161:
Sonnet User’s Guide 13 Drag the m
- Page 162 and 163:
Sonnet User’s Guide 19 Once all t
- Page 164 and 165:
Sonnet User’s Guide 24 Move the m
- Page 166 and 167:
Sonnet User’s Guide 6 Click on th
- Page 168 and 169:
Sonnet User’s Guide Executing the
- Page 170 and 171:
Sonnet User’s Guide 24 Click on t
- Page 172 and 173:
Sonnet User’s Guide ments (S 21 a
- Page 174 and 175: Sonnet User’s Guide 30 Select Opt
- Page 176 and 177: Sonnet User’s Guide As mentioned
- Page 178 and 179: Sonnet User’s Guide Running an Op
- Page 180 and 181: Sonnet User’s Guide 52 Click on t
- Page 182 and 183: Sonnet User’s Guide 55 Select Ana
- Page 184 and 185: Sonnet User’s Guide The results c
- Page 186 and 187: Sonnet User’s Guide in each confo
- Page 188 and 189: Sonnet User’s Guide 3 Select “C
- Page 190 and 191: Sonnet User’s Guide Rule 2: Figur
- Page 192 and 193: Sonnet User’s Guide You should lo
- Page 194 and 195: Sonnet User’s Guide Current Densi
- Page 196 and 197: Sonnet User’s Guide 196
- Page 198 and 199: Sonnet User’s Guide Networks A ne
- Page 200 and 201: Sonnet User’s Guide You can edit
- Page 202 and 203: Sonnet User’s Guide The S-Paramet
- Page 204 and 205: Sonnet User’s Guide 3 Combines th
- Page 206 and 207: Sonnet User’s Guide The geometry
- Page 208 and 209: Sonnet User’s Guide The figure be
- Page 210 and 211: Sonnet User’s Guide 210
- Page 212 and 213: Sonnet User’s Guide The circuit s
- Page 214 and 215: Sonnet User’s Guide vide command,
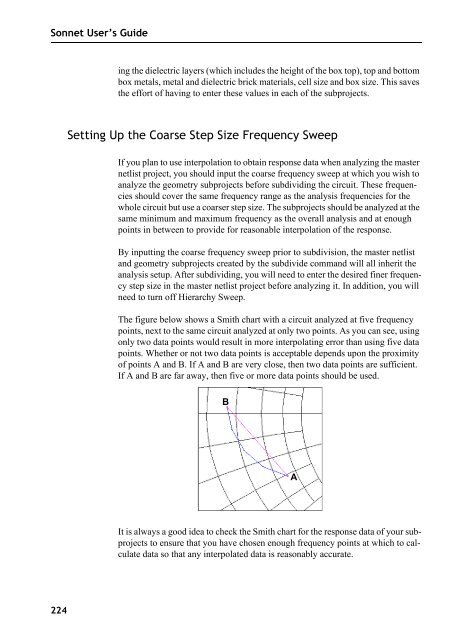
- Page 216 and 217: Sonnet User’s Guide 9 It is often
- Page 218 and 219: Sonnet User’s Guide The second ex
- Page 220 and 221: Sonnet User’s Guide The subdivisi
- Page 222 and 223: Sonnet User’s Guide Before adding
- Page 226 and 227: Sonnet User’s Guide 226
- Page 228 and 229: Sonnet User’s Guide Obtaining the
- Page 230 and 231: Sonnet User’s Guide 5 Move your c
- Page 232 and 233: Sonnet User’s Guide 8 Select Anal
- Page 234 and 235: Sonnet User’s Guide If you wish t
- Page 236 and 237: Sonnet User’s Guide Analysis of t
- Page 238 and 239: Sonnet User’s Guide this example,
- Page 240 and 241: Sonnet User’s Guide 240
- Page 242 and 243: Sonnet User’s Guide If a microstr
- Page 244 and 245: Sonnet User’s Guide Examples of v
- Page 246 and 247: Sonnet User’s Guide Adding a Via
- Page 248 and 249: Sonnet User’s Guide If the via to
- Page 250 and 251: Sonnet User’s Guide 4 Click on OK
- Page 252 and 253: Sonnet User’s Guide Simple Via Ex
- Page 254 and 255: Sonnet User’s Guide When using th
- Page 256 and 257: Sonnet User’s Guide 3 Select Thic
- Page 258 and 259: Sonnet User’s Guide the thick met
- Page 260 and 261: Sonnet User’s Guide Modeling an A
- Page 262 and 263: Sonnet User’s Guide For instance,
- Page 264 and 265: Sonnet User’s Guide Y Level 1 X L
- Page 266 and 267: Sonnet User’s Guide Air Dielectri
- Page 268 and 269: Sonnet User’s Guide Finally, it i
- Page 270 and 271: Sonnet User’s Guide 2 Select Modi
- Page 272 and 273: Sonnet User’s Guide 3 Enter the n
- Page 274 and 275:
Sonnet User’s Guide Background Si
- Page 276 and 277:
Sonnet User’s Guide First Conditi
- Page 278 and 279:
Sonnet User’s Guide A dual patch
- Page 280 and 281:
Sonnet User’s Guide frequency (i.
- Page 282 and 283:
Sonnet User’s Guide Spherical Coo
- Page 284 and 285:
Sonnet User’s Guide Magnitude (dB
- Page 286 and 287:
Sonnet User’s Guide Polarization
- Page 288 and 289:
Sonnet User’s Guide Uniform Curre
- Page 290 and 291:
Sonnet User’s Guide The far field
- Page 292 and 293:
Sonnet User’s Guide 10 Click on t
- Page 294 and 295:
Sonnet User’s Guide 18 Click on t
- Page 296 and 297:
Sonnet User’s Guide When the mous
- Page 298 and 299:
Sonnet User’s Guide We shall now
- Page 300 and 301:
Sonnet User’s Guide 31 To turn of
- Page 302 and 303:
Sonnet User’s Guide 35 Click on t
- Page 304 and 305:
Sonnet User’s Guide 40 Double-cli
- Page 306 and 307:
Sonnet User’s Guide 50 Select Gra
- Page 308 and 309:
Sonnet User’s Guide 308
- Page 310 and 311:
Sonnet User’s Guide project edito
- Page 312 and 313:
Sonnet User’s Guide The PI model
- Page 314 and 315:
Sonnet User’s Guide 4 Select Outp
- Page 316 and 317:
Sonnet User’s Guide * Limits: C>0
- Page 318 and 319:
Sonnet User’s Guide Shown below i
- Page 320 and 321:
Sonnet User’s Guide ment circuits
- Page 322 and 323:
Sonnet User’s Guide 6 Enter the d
- Page 324 and 325:
Sonnet User’s Guide Upon the comp
- Page 326 and 327:
Sonnet User’s Guide Generating fi
- Page 328 and 329:
Sonnet User’s Guide where is the
- Page 330 and 331:
Sonnet User’s Guide To obtain the
- Page 332 and 333:
Sonnet User’s Guide dure. These s
- Page 334 and 335:
Sonnet User’s Guide Then create a
- Page 336 and 337:
Sonnet User’s Guide Box Resonance
- Page 338 and 339:
Sonnet User’s Guide Some of the t
- Page 340 and 341:
Sonnet User’s Guide For evaluatio
- Page 342 and 343:
Sonnet User’s Guide When we vary
- Page 344 and 345:
Sonnet User’s Guide 344
- Page 346 and 347:
Sonnet User’s Guide is one or mo
- Page 348 and 349:
Sonnet User’s Guide Causal Dielec
- Page 350 and 351:
Sonnet User’s Guide Each entry co
- Page 352 and 353:
Sonnet User’s Guide 352
- Page 354 and 355:
Sonnet User’s Guide [7] James C.
- Page 356 and 357:
Sonnet User’s Guide [33] James C.
- Page 358 and 359:
Sonnet User’s Guide [61] J. C. Ra
- Page 360 and 361:
Sonnet User’s Guide [91] R. Horto
- Page 362 and 363:
Sonnet User’s Guide bricks see di
- Page 364 and 365:
Sonnet User’s Guide convergence t
- Page 366 and 367:
Sonnet User’s Guide independent v
- Page 368 and 369:
Sonnet User’s Guide update 182 Op
- Page 370 and 371:
Sonnet User’s Guide Sonnet Lite 2
- Page 372:
Sonnet User’s Guide Z Z current 2