
Create successful ePaper yourself
Turn your PDF publications into a flip-book with our unique Google optimized e-Paper software.
<strong>Ivie</strong> <strong>IE</strong>-<strong>33</strong> & <strong>IE</strong>-<strong>35</strong> <strong>Manual</strong><br />
<strong>IE</strong>-<strong>33</strong> & <strong>IE</strong>-<strong>35</strong><br />
January, 2006<br />
Audio Analysis Systems<br />
Owner's and Operator's <strong>Manual</strong><br />
Copyright 2006<br />
<strong>Ivie</strong> Technologies Inc.<br />
Lehi, UT<br />
Printed in U.S.A.<br />
page 1
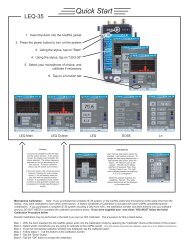
<strong>IE</strong>-<strong>33</strong> Quick Start<br />
Starting the <strong>IE</strong>-<strong>33</strong><br />
Max Resolution<br />
240 points<br />
60 - 1/6 Octave<br />
bands<br />
30 - 1/3 Octave<br />
bands<br />
10 - 1 Octave<br />
bands<br />
page 2<br />
1. Insert the iPAQ into the <strong>IE</strong>-<strong>33</strong>J<br />
jacket and plug the <strong>IE</strong>-<strong>33</strong>M<br />
microphone into the <strong>IE</strong>-<strong>33</strong>J<br />
dB/division display<br />
Memory Snapshot /Average<br />
Sample button (See"Averaging"<br />
& Memory sections of the manual)<br />
dB/Center display<br />
Store/Recall Memories<br />
Average display On/Off<br />
RTA display On/Off<br />
Weighting - A,C, Flat<br />
Start/Stop RTA<br />
Once the RTA display is stopped<br />
use the Joystick to select and<br />
read dB levels of individual<br />
frequency bands.<br />
SPL Response - Fast,<br />
Slow, Peak, Impulse<br />
dB Center UP/Down<br />
(In increments set by dB/Div)<br />
Frequency Select<br />
(Used in memory recall)<br />
2. Press power button<br />
to turn on <strong>IE</strong>-<strong>33</strong><br />
3. Using the stylus tap on<br />
"Start"<br />
4. Using the stylus tap<br />
on "<strong>IE</strong>-<strong>33</strong>"<br />
5. Wait while the program<br />
starts and memories are<br />
loaded<br />
6. The screen of the last<br />
used function will<br />
appear<br />
7. Tap the "Function"<br />
menu and choose the<br />
desired function<br />
Pushing the center of the<br />
Joystick performs the same<br />
function as Start/Stop RTA<br />
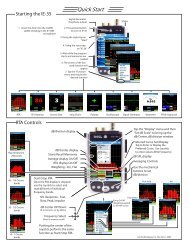
<strong>Ivie</strong> <strong>IE</strong>-<strong>33</strong> & <strong>IE</strong>-<strong>35</strong> <strong>Manual</strong><br />
Stylus - Press to release<br />
RTA RTA/LED SPL Monitor Seat to Seat Strip Chart Polarity Oscilloscope Signal Generator<br />
RTA Controls<br />
Turns On/Off<br />
Weighting applied<br />
to the RTA screen.<br />
Note: Freq Detect<br />
is only<br />
accessable from<br />
the Max Res<br />
screen.<br />
Tap the "Display" menu and then<br />
"Set dB Scale" to bring up the<br />
dB/Center, dB division window<br />
Preferred Curve Set/Display<br />
Tap to Enter or Display the<br />
Preferred Curve. Use Joystick<br />
to enter values: dB & Frequency<br />
dB SPL display<br />
Averaging Controls<br />
Tap on screen or use the<br />
mechanical buttons to set<br />
dB/division<br />
Freq Detect<br />
Peak Hold NR<br />
NC<br />
<strong>Ivie</strong> Technologies, Inc Rev. November, 2005
<strong>Ivie</strong> <strong>IE</strong>-<strong>33</strong> & <strong>IE</strong>-<strong>35</strong> <strong>Manual</strong><br />
Step 1 - Insert the iPAQ into the <strong>IE</strong>-<strong>33</strong>J jacket<br />
and plug the <strong>IE</strong>-<strong>33</strong>M microphone into<br />
the <strong>IE</strong>-<strong>33</strong>J.<br />
Step 2 -<br />
Step 3 -<br />
Step 4 -<br />
Press power button to<br />
turn on <strong>IE</strong>-<strong>33</strong>.<br />
Using the stylus tap<br />
on "Start."<br />
Step 5 - Wait while the program<br />
starts and memories are<br />
loaded.<br />
Step 6 -<br />
Step 7 -<br />
Using the stylus tap<br />
on "<strong>IE</strong>-<strong>33</strong>."<br />
The screen of the last<br />
used function will<br />
appear.<br />
Tap the "Function" menu<br />
and choose the desired<br />
function.<br />
Step 8 - Start using the <strong>IE</strong>-<strong>33</strong>.<br />
<strong>IE</strong>-<strong>33</strong> Quick Start<br />
Stylus - press to release.<br />
page 3
<strong>IE</strong>-<strong>35</strong> Quick Start<br />
Starting the <strong>IE</strong>-<strong>35</strong><br />
page 4<br />
1. Insert the Axim into the <strong>Ivie</strong>PAL<br />
jacket and plug in the <strong>IE</strong>-<strong>35</strong>M<br />
microphone<br />
Max Resolution<br />
240 points<br />
60 - 1/6 Octave<br />
bands<br />
30 - 1/3 Octave<br />
bands<br />
10 - 1 Octave<br />
bands<br />
dB/division display<br />
dB/Center display<br />
Store/Recall Memories<br />
Average display On/Off<br />
RTA display On/Off<br />
Weighting - A,C, Flat<br />
Start/Stop RTA<br />
Once the RTA display is stopped<br />
use the Joystick to select and<br />
read dB levels of individual<br />
frequency bands.<br />
SPL Response - Fast,<br />
Slow, Peak, Impulse<br />
dB Center UP/Down<br />
(In increments set by dB/Div)<br />
Frequency Select<br />
(Used in memory recall)<br />
Pushing the center of the<br />
Joystick performs the same<br />
function as Start/Stop RTA<br />
Signal Generator<br />
/Earphone output<br />
2. Press power button<br />
to turn on <strong>IE</strong>-<strong>35</strong><br />
3. Using the stylus tap on<br />
"Start"<br />
4. Using the stylus tap<br />
on "<strong>IE</strong>-36"<br />
5. Wait while the program<br />
starts and memories are<br />
loaded<br />
6. The screen of the last<br />
used function will<br />
appear<br />
7. Tap the "Function"<br />
menu and choose the<br />
desired function<br />
<strong>Ivie</strong> <strong>IE</strong>-<strong>33</strong> & <strong>IE</strong>-<strong>35</strong> <strong>Manual</strong><br />
RTA SPL Monitor Seat to Seat Strip Chart Polarity Oscilloscope Signal Generator Voltmeter RT60 (Optional)<br />
RTA Controls<br />
Stylus<br />
Freq Detect<br />
Turns On/Off<br />
Weighting<br />
applied to<br />
the RTA<br />
screen.<br />
Tap the "Display" menu and then<br />
"Set dB Scale" to bring up the<br />
dB/Center, dB division window<br />
Preferred Curve Set/Display<br />
Tap to Enter or Display the<br />
Preferred Curve. Use Joystick<br />
to enter values: dB & Frequency<br />
dB SPL display<br />
Averaging Controls<br />
Use the mechanical<br />
buttons to set<br />
dB/division<br />
Peak Hold NR<br />
NC<br />
<strong>Ivie</strong> Technologies, Inc Rev. Nov1, 2005
<strong>Ivie</strong> <strong>IE</strong>-<strong>33</strong> & <strong>IE</strong>-<strong>35</strong> <strong>Manual</strong><br />
RTA Memories RTA Averaging Functions<br />
The various averaging functions of the <strong>IE</strong>-<strong>33</strong> constitute one of the most powerful<br />
feature sets in the instrument. Spatial averaging is made easier (you don't have to<br />
average one memory with another). Averaging samples can be automatically or<br />
manually collected. The user can select Arithmetic or Power averages. See the<br />
manual for a complete outline of the <strong>IE</strong>-<strong>33</strong>'s powerful averaging features.<br />
The <strong>IE</strong>-<strong>33</strong> offers powerful Memory Management functions (see manual for details).<br />
Basically, there are nine Scratch Memories, an Average memory and a Preferred Curve<br />
memory available via on-screen controls, but spectra captured in these temporary<br />
Scratch Memory slots can be renamed and stored in virtually unlimited number.<br />
Continuous Mode Tigger Mode<br />
Step 1 - Select either the Continuous<br />
(Cont.) or Trigger mode for<br />
Averaging.<br />
Buff colored 1, 2, 4 & 5 = Curves are<br />
stored in these memories but they are<br />
not currently being displayed.<br />
Memory #3 being displayed<br />
The Continuous mode will<br />
automatically take sample after<br />
sample until the "Pause/Resume"<br />
control is pressed.<br />
Red colored 6, 7, 8 & 9 = These<br />
Scratch memories are empty and<br />
available for curve storage.<br />
Store a curve to memory<br />
Step 1 - Tap an empty Scratch<br />
memory location 1 - 9 (colored in<br />
Red). The curve will appear on the<br />
screen and the Scratch memory<br />
background color will turn Blue<br />
indicating it is now filled and being<br />
displayed.<br />
The Trigger mode will take only one<br />
sample each time the "Add" control is<br />
pressed or the Thumb button on the<br />
side of the <strong>IE</strong>-<strong>33</strong> is pressed.<br />
Red "PE" Preferred curve not stored.<br />
Blue = Scratch memory #3 displayed.<br />
Red "A"= No Average curve is stored.<br />
Green "R" = RTA curve is displayed.<br />
Tap the Blue Scratch memory to<br />
remove the stored curve from the<br />
display. The background color will<br />
turn to Buff indicating that the<br />
memory is filled but not presently<br />
displayed.<br />
Step 2 - Tap on the "Average-P"<br />
control to enter into Average mode.<br />
Step 3 - The "Average" display will be replaced with a "Count=X" display,<br />
with X= the number of samples taken. In the Trigger mode the Count will<br />
be incremented with each tap of the "Add" control. In the Continuous<br />
mode the Count will be controlled by the "Pause/Resume" control.<br />
Step 2 - To store a Scratch memory to the<br />
main memory, tap on the "Memory" control to<br />
bring up the memory management screen.<br />
Step 4 - Store the Average curve by selecting any un-used scratch<br />
memory. If you wish to store the real-time curve instead of the Average<br />
curve, turn off the Average curve display before pressing the Scratch<br />
Memory Store control.<br />
Tap "Clear" to Clear the Average curve and reset the Count to zero.<br />
Tap "Count" to Exit the Average mode.<br />
To Select Averaging Method<br />
1 - Tap "File."<br />
2 - Tap "Preferences."<br />
3 - Tap either "Power Average."<br />
or "Arithmetic Average."<br />
Real time "R" display Off<br />
Average "A" display turned on.<br />
Real time "R" and Average<br />
"A" displays turned on.<br />
Tap on a memory file to<br />
move it into a Scratch<br />
memory so it can<br />
displayed.<br />
From this screen you can "Store" a Scratch memory to<br />
main memory or "Load" a memory from main back into<br />
a Scratch memory. Preferred, Peak and Subtraction<br />
memories can also be "Stored" and "Loaded."<br />
Re-name a memory<br />
from "Scratch" to a more<br />
descriptive name and<br />
tap on "OK."<br />
<strong>IE</strong>-<strong>35</strong> Quick Start<br />
Average Curve<br />
Subtract / Display Two Memories<br />
Memory Cursor<br />
Green = Display On<br />
Step 1 - Tap<br />
on the yellow<br />
"Subtract"<br />
control.<br />
Buff = Disp Off<br />
Step 1 - Tap on "Display" then "Memory<br />
Cursor."<br />
Step 2 - Tap on "Stop."<br />
Step 3 - Turn RTA display On/Off as desired.<br />
Step 4- Use Left/Right Cursor to select the<br />
frequency.<br />
Green = Disp On<br />
With Average<br />
curve displayed,<br />
press an empty<br />
(red color) Scratch<br />
Memory to store.<br />
Step 3 - The result will be displayed in<br />
yellow on the screen. To exit this mode, tap<br />
on "Subtract" and then "CANCEL."<br />
Step 2 - Select two<br />
sources or<br />
spectrums for<br />
comparison:<br />
Scratch Memory,<br />
Preferred Curve,<br />
RTA Display or<br />
Average and then<br />
Tap "S1 - S2."<br />
dB<br />
Freq<br />
page 5
<strong>IE</strong>-<strong>33</strong> Controls<br />
Introduction<br />
page 6<br />
<strong>Ivie</strong> <strong>IE</strong>-<strong>33</strong> & <strong>IE</strong>-<strong>35</strong> <strong>Manual</strong><br />
Congratulations! With your purchase of the <strong>Ivie</strong> <strong>IE</strong>-<strong>33</strong>, or <strong>IE</strong>-<strong>35</strong>, you not only have one of the most powerful, versatile,<br />
and accurate audio spectrum analyzers available, but you also have an analysis system that is capable of<br />
expanding as your needs expand. The supplied microphone is a Type II microphone, making the standard <strong>IE</strong>-<strong>33</strong>,<br />
or <strong>IE</strong>-<strong>35</strong>, a Type II measurement system. For those needing Type I accuracy, an optional microphone, preamplifier<br />
and extension cable is available to convert either analyzer to a Type I measurement system. With reasonable<br />
care, the <strong>IE</strong>-<strong>33</strong> and <strong>IE</strong>-<strong>35</strong> will provide a long period of useful service.<br />
This manual is intended to familiarize you with the basic operations of the <strong>IE</strong>-<strong>33</strong> and <strong>IE</strong>-<strong>35</strong>, and to whet your<br />
appetite concerning some of its possibilities. It is in no way intended to be the total description of all the possibilities<br />
of these units.<br />
The <strong>IE</strong>-<strong>33</strong> software runs on the HP© iPAQ© and requires an iPAQ 3950, or later jacket compatible model. (See<br />
the <strong>IE</strong>-<strong>33</strong> FAQ at www.ivie.com for a complete list of compatible iPAQ models). Pocket PC 2003 OS is required<br />
and ActiveSync software Version 3.7.1 or later. The <strong>IE</strong>-<strong>35</strong> software runs on the Dell® Axim® X50 or later model.<br />
(The <strong>IE</strong>-<strong>35</strong> is shipped with the Dell® Axim® X51v). Pocket PC 2005 is required and ActiveSync software Version<br />
4.0, or later.<br />
*******NOTICE!! <strong>IE</strong>-<strong>33</strong> POTENTIAL DATA LOSS!!*******<br />
The iPAQ, like all PDA’s runs on battery power. HP® is clear in their warnings about data loss if the battery is<br />
completely run down. If you run the battery all the way down, your data can and will be lost! (This has a much<br />
harsher sound if you’ve just completed a couple of days of taking measurements when the data goes bye bye!).<br />
To guard against accidental data loss, a backup utility is included in the iPAQ software suite. This utility is easy<br />
to use. You can schedule regular (even daily) backups that will happen automatically, or you can start backups<br />
manually. The Sprite Backup utility included with the iPAQ will back up to the “iPAQ File Store” (an 8 MB non<br />
volatile storage area in the iPAQ itself), or to an SD-style memory card that plugs into the iPAQ’s SD card slot.<br />
Sprite also makes a separate backup utility which can be used to back up your iPAQ to the hard drive of your<br />
PC. We recommend that you make provision for backing up your <strong>IE</strong>-<strong>33</strong> data on a regular basis.<br />
The <strong>IE</strong>-<strong>35</strong> does not have this concern. It is based on the Dell® Axim® X51v which features “Retentive<br />
Memory.” The <strong>IE</strong>-<strong>35</strong> will not lose data, even if the battery is accidentally run down.<br />
<strong>IE</strong>-<strong>33</strong> Controls (<strong>IE</strong>-<strong>35</strong> Controls are Further Detailed on Pages 8 & 9)<br />
As demonstrated across the page, the <strong>IE</strong>-<strong>33</strong> makes use of a number of different controls, both software and<br />
hardware based. The controls can be divided into three categories: 1) Hardware Buttons, 2) Software Defined<br />
Stylus Buttons and 3) Pop-up Menus. Like the stylus buttons, the pop-up menus are activated using the stylus.<br />
Hardware Buttons (<strong>IE</strong>-<strong>33</strong>)<br />
The <strong>IE</strong>-<strong>33</strong> software defines the use of the iPAQ hardware buttons as shown across the page. The thumb button,<br />
for example, can be used to take a memory "snapshot" when in the RTA mode. It is also used to pause or<br />
resume taking samples when in the Average Continuous mode and to "add a single sample" when in the Memory<br />
Trigger mode. These features are covered in detail in the section of this manual dealing with memory functions.<br />
Stylus Buttons (<strong>IE</strong>-<strong>33</strong>)<br />
The stylus buttons contain many of the most used features of the <strong>IE</strong>-<strong>33</strong>. They are clearly labeled and very intuitive.<br />
Some duplicate the function of hardware buttons, as in the Zoom In and Zoom Out functions, as shown in<br />
the illustration on page 3. The stylus buttons allow selection of the RTA display in octave, one third octave,
<strong>Ivie</strong> <strong>IE</strong>-<strong>33</strong> & <strong>IE</strong>-<strong>35</strong> <strong>Manual</strong><br />
Microphone level input.<br />
Channel 1 Line level input.<br />
Channel 2 Line level input.<br />
Audio Output Jack on Ipaq 5500<br />
series(3.5mm stereo) - Can be used as<br />
headphone jack or as output for the Signal<br />
Generator.<br />
Thumb Button - Instant Memory<br />
Snapshot. During Average controls<br />
"Pause/Resume" in continuous<br />
mode and "Add" in Trigger mode.<br />
Software defined buttons.<br />
<strong>IE</strong>-<strong>33</strong>M - Microphone.<br />
Speaker.<br />
Options<br />
SD Memory expansion slot.<br />
iPAQ - Power On/OFF.<br />
Joystick - Left/Right - Frequency selection.<br />
<strong>IE</strong>-<strong>33</strong> Controls<br />
Audio Output Jack on Ipaq 3900<br />
series(3.5mm stereo) - Can be used as<br />
headphone jack or as output for the Signal<br />
Generator.<br />
<strong>IE</strong>-<strong>33</strong>J - Jacket Shown with<br />
optional extended battery pack.<br />
Charging indicator - Flashes<br />
while charging, on full-time when<br />
charging completed.<br />
Stylus - Push to release.<br />
Sound Pressure Level and<br />
Weighting display.<br />
Status Window -<br />
Red = Function Stopped by user.<br />
Green = Function Running.<br />
Joystick -<br />
Up/Down - dB.<br />
Range, dB Level.<br />
page 7
<strong>IE</strong>-<strong>35</strong> Controls<br />
page 8<br />
<strong>Ivie</strong> <strong>IE</strong>-<strong>33</strong> & <strong>IE</strong>-<strong>35</strong> <strong>Manual</strong><br />
one sixth octave or maximum resolution. The Decay stylus button adjusts the display averaging time.<br />
Successively tapping it rotates from Decay 1, to Decay 2, to Decay 3 and back to Decay 1 again. Many of the<br />
averaging functions and the memory functions are controlled by the stylus buttons.<br />
Pop-Up Menus (<strong>IE</strong>-<strong>33</strong>)<br />
The pop-up menus add tremendous flexibility to the <strong>IE</strong>-<strong>33</strong>. Tapping the "Function" pop-up menu, for example,<br />
allows you to select one of the many functions of the <strong>IE</strong>-<strong>33</strong>. Choices include RTA, RTA with an LED display<br />
appearance, SPL Monitor, Seat to Seat (SPL variation), Strip Chart function, Polarity measurement, Oscilloscope<br />
function, Signal Generator, Volt Meter and RT-60, if the RT-60 software module has been purchased..<br />
The "Options" pop-up menu allows the setting of display scale (Set dB Scale), provides for RTA display weighting,<br />
allows the display of Peak Hold on the RTA screen, and provides for the selection of NC and NR measurements.<br />
Entering a "Preferred Curve" is possible as well as activating Audio Feed Through to the iPAQ audio<br />
output. It is possible to Play a Test Wave file, or continuously loop through a wave file (Play Test Loop). The<br />
menu items in the “Options” pop-up menu are interactive with the “Function” pop-up menu. As different functions<br />
are selected, different options for the selected function will appear in the “Options” pop-up menu.<br />
<strong>IE</strong>-<strong>35</strong> Controls<br />
As demonstrated across the page, the <strong>IE</strong>-<strong>35</strong> makes use of a number of different controls, both software and<br />
hardware based. The controls can be divided into three categories: 1) Hardware Buttons, 2) Software Defined<br />
Stylus Buttons and 3) Pop-up Menus. Like the stylus buttons, the pop-up menus are activated using the stylus.<br />
Hardware Buttons (<strong>IE</strong>-<strong>35</strong>)<br />
The <strong>IE</strong>-<strong>35</strong> software defines the use of the Axim hardware buttons as shown across the page. The lower thumb<br />
button, for example, can be used to take a memory "snapshot" when in the RTA mode. It can also pause or<br />
resume taking samples in the Average Continuous mode and can "add a single sample" when in the Memory<br />
Trigger mode. These features are covered in detail in the section of this manual dealing with memory functions.<br />
Stylus Buttons (<strong>IE</strong>-<strong>35</strong>)<br />
The stylus buttons contain many of the most used features of the <strong>IE</strong>-<strong>35</strong>. They are clearly labeled and very intuitive.<br />
Some duplicate the function of hardware buttons, as in the Zoom In and Zoom Out functions, as shown in<br />
the illustration on page 5. The stylus buttons allow selection of the RTA display in octave, one third octave,<br />
one sixth octave or maximum resolution. The Decay stylus button adjusts the display averaging time.<br />
Successively tapping rotates it from Decay 1, to Decay 2, to Decay 3 and back to Decay 1 again. Many of the<br />
averaging functions and the memory functions are controlled by the stylus buttons.<br />
Pop-Up Menus (<strong>IE</strong>-<strong>35</strong>)<br />
The pop-up menus add tremendous flexibility to the <strong>IE</strong>-<strong>35</strong>. Tapping the "Function" pop-up menu, for example,<br />
allows you to select one of the many functions of the <strong>IE</strong>-<strong>35</strong>. Choices include RTA, RTA with an LED display<br />
appearance, SPL Monitor, Seat to Seat (SPL variation), Strip Chart function, Polarity measurement, Oscilloscope<br />
function, Signal Generator, Volt Meter and RT-60, if the RT-60 software module has been purchased..<br />
The "Options" pop-up menu allows the setting of display scale (Set dB Scale), provides for RTA display weighting,<br />
allows the display of Peak Hold on the RTA screen, and provides for the selection of NC and NR measurements.<br />
Entering a "Preferred Curve" is possible as well as activating Audio Feed Through to the Axim audio output.<br />
It is possible to Play a Test Wave file, or continuously loop through a wave file (Play Test Loop).<br />
The menu items in the “Options” pop-up menu are interactive with the “Function” pop-up menu. As different<br />
functions are selected, different options for the selected function will appear in the “Options” pop-up menu.
<strong>Ivie</strong> <strong>IE</strong>-<strong>33</strong> & <strong>IE</strong>-<strong>35</strong> <strong>Manual</strong><br />
Microphone level input<br />
Switchcraft QG TA4 series.<br />
SD and CF card memory expansion<br />
slots. The CF slot is used by the<br />
<strong>Ivie</strong>PAL to send data to the Dell Axim.<br />
The SD card is available for use, and<br />
is accessable when the Axim is<br />
removed from the <strong>Ivie</strong>PAL.<br />
Channel 2 Line level input<br />
RCA connector.<br />
Channel 1 Line level input<br />
RCA connector.<br />
Audio Output Jack - 3.5mm<br />
stereo - Can be used as<br />
headphone jack or as output<br />
for the Signal Generator.<br />
<strong>Ivie</strong>PAL Jacket<br />
Software defined buttons.<br />
Speaker- Surrounds<br />
the joystick button.<br />
To remove the Dell Axim from<br />
the <strong>Ivie</strong>PAL, depress the latch<br />
located on the end of the<br />
<strong>Ivie</strong>PAL and slide the Axim<br />
down and out of the <strong>Ivie</strong>PAL.<br />
Slide straight away from<br />
CF connector<br />
<strong>IE</strong>-<strong>35</strong>M - Microphone.<br />
<strong>IE</strong>-<strong>35</strong> Controls<br />
Stylus - Pull up to access.<br />
Wireless Indicator - Flashes<br />
Green when WiFi is in use.<br />
Flashes Blue when Bluetooth is<br />
in use.<br />
Power On/OFF<br />
Charging indicator - On/Off<br />
power button is illuminated<br />
Orange while charging and<br />
Green when the charge is<br />
completed.<br />
Sound Pressure Level<br />
and Weighting display.<br />
Status Window -<br />
Red = Function Stopped by user.<br />
Green = Function Running.<br />
Joystick - Left/Right -<br />
Frequency selection.<br />
Up/Down - dB.<br />
Range, dB Level.<br />
page 9
Getting Started<br />
Getting Started with Your <strong>IE</strong>-<strong>33</strong> or <strong>IE</strong>-<strong>35</strong><br />
page 10<br />
<strong>Ivie</strong> <strong>IE</strong>-<strong>33</strong> & <strong>IE</strong>-<strong>35</strong> <strong>Manual</strong><br />
Important Note: The <strong>IE</strong>-<strong>33</strong> and <strong>IE</strong>-<strong>35</strong> have identical feature sets and identical software “look and<br />
feel.” There are some appearance enhancements with the VGA graphics of the <strong>IE</strong>-<strong>35</strong>, but the software<br />
screens are functionally identical. While most of the illustrations in this manual show the <strong>IE</strong>-<strong>33</strong>, the<br />
<strong>IE</strong>-<strong>35</strong> operation is identical, except where noted.<br />
If you purchased the <strong>IE</strong>-<strong>33</strong> or <strong>IE</strong>-<strong>35</strong> complete, you will not need to install the software in the iPAQ or Axim, or<br />
calibrate the microphone to the unit. If you purchased just the <strong>IE</strong>-<strong>33</strong>J Jacket, or <strong>IE</strong>-<strong>35</strong> PAL, you will need to do<br />
some preliminary work before you can begin using your analyzer. If you are already familiar with installing software<br />
on a PDA, the following information will simply confirm what you already know.<br />
<strong>IE</strong>-<strong>33</strong>J Jacket & <strong>IE</strong>-<strong>35</strong> PAL: Data and Program Transfer<br />
If you have purchased the <strong>IE</strong>-<strong>33</strong>J (jacket without iPAQ ), or the <strong>IE</strong>-<strong>35</strong> PAL (jacket without Axim) you will need to<br />
install the analyzer software on your PDA in order to use the unit and make measurements. Even if you have a<br />
complete <strong>IE</strong>-<strong>33</strong> or <strong>IE</strong>-<strong>35</strong> package, you will have need to install software upgrades and updates as they become<br />
available. Also, after measurement sessions, you may wish to bring your data files across from the analyzer to<br />
your PC for printing or further data manipulation.<br />
All data and program transfers between the PDA and your PC are done using Microsoft's ActiveSync software<br />
(Version 3.7.1 for the <strong>IE</strong>-<strong>33</strong> and Version 4.0 or later for the <strong>IE</strong>-<strong>35</strong>). ActiveSync is provided on the standard PDA<br />
CD that accompanies your iPAQ or Axim. Follow the instructions provided with your unit to install the<br />
ActiveSync software and create a "partnership" between your PDA and your PC. ActiveSync is also available<br />
directly from Microsoft’s web site. Questions about the ActiveSync communication between a PDA and PC are<br />
supported by PDA Manufacturer. If you have problems setting up ActiveSync, contact Technical Support for HP<br />
or Dell.<br />
For further information on this subject, refer to Appendix III of this manual titled " Data and Program Transfer."<br />
Beginning to Use the <strong>IE</strong>-<strong>33</strong> or <strong>IE</strong>-<strong>35</strong><br />
As shown in the illustrations across the page, firing up an <strong>IE</strong>-<strong>33</strong> or <strong>IE</strong>-<strong>35</strong> is simple. After sliding on the jacket<br />
and making sure it is firmly seated, plug in the microphone. Turn on the unit using the power button by giving it<br />
a quick press and release. Using the stylus, select <strong>IE</strong>-<strong>33</strong> or <strong>IE</strong>-<strong>35</strong> from the menu to begin running the software.<br />
Next, select the function you wish to use and you're off and running.<br />
Microphone Calibration<br />
If you purchased the <strong>IE</strong>-<strong>33</strong> or <strong>IE</strong>-<strong>35</strong> complete, the microphone will have already been calibrated to the unit<br />
before it left the factory. If you purchased the <strong>IE</strong>-<strong>33</strong>J Jacket, or the <strong>IE</strong>-<strong>35</strong> PAL only to use with your own iPAQ or<br />
Axim, you will need to calibrate the microphone. For the calibration procedure, consult Appendix II of this manual<br />
titled "<strong>IE</strong>-<strong>33</strong> and <strong>IE</strong>-<strong>35</strong> Mic Calibration."<br />
The supplied microphone for the <strong>IE</strong>-<strong>33</strong> is silver, while the microphone for the <strong>IE</strong>-<strong>35</strong> is gold in color. However,<br />
both microphones are Type II, electret microphones and are functionally identical and interchangeable.<br />
Obviously, whenever a new or different microphone is used, your unit will need to be recalibrated. Both the<br />
<strong>IE</strong>-<strong>33</strong> and the <strong>IE</strong>-<strong>35</strong> are capable of storing microphone calibrations for up to six different microphones. When a<br />
different microphone is used, it’s stored calibration adjustment can simply be selected without having to go<br />
through a calibration procedure all over again.<br />
These instrumentation microphones are sensitive instruments and should be carefully handled to avoid damage.
<strong>Ivie</strong> <strong>IE</strong>-<strong>33</strong> & <strong>IE</strong>-<strong>35</strong> <strong>Manual</strong><br />
Step 1 - Insert the iPAQ into the <strong>IE</strong>-<strong>33</strong>J jacket<br />
and plug the <strong>IE</strong>-<strong>33</strong>M microphone into<br />
the <strong>IE</strong>-<strong>33</strong>J.<br />
Step 2 -<br />
Step 3 -<br />
Step 4 -<br />
Press power button to<br />
turn on <strong>IE</strong>-<strong>33</strong>.<br />
Using the stylus tap<br />
on "Start."<br />
Step 5 - Wait while the program<br />
starts and memories are<br />
loaded.<br />
Step 6 -<br />
Step 7 -<br />
Using the stylus tap<br />
on "<strong>IE</strong>-<strong>33</strong>."<br />
The screen of the last<br />
used function will<br />
appear.<br />
Tap the "Function" menu<br />
and choose the desired<br />
function.<br />
Step 8 - Start using the <strong>IE</strong>-<strong>33</strong>.<br />
Getting Started<br />
Stylus - press to release.<br />
page 11
Real Time Analyzer Controls<br />
Real Time Analyzer Controls<br />
page 12<br />
<strong>Ivie</strong> <strong>IE</strong>-<strong>33</strong> & <strong>IE</strong>-<strong>35</strong> <strong>Manual</strong><br />
Stylus Buttons: The <strong>IE</strong>-<strong>33</strong> and <strong>IE</strong>-<strong>35</strong> are several instruments in the same package: Real Time Analyzer,<br />
Sound Level Meter, Signal Generator, Oscilloscope etc. One of their most powerful functions is Real Time<br />
Analyzer (RTA). To make operation simple and intuitive, the most often used controls for the RTA are labeled<br />
stylus buttons. The illustration across the page shows the stylus buttons associated with the RTA. Displays of<br />
octave, third octave, sixth octave and maximum resolution (2048 FFT data points) are selectable as shown.<br />
iPAQ and Axim Buttons: The <strong>IE</strong>-<strong>33</strong> and <strong>IE</strong>-<strong>35</strong> make use of the buttons found on the iPAQ and the Axim. Their<br />
use is defined as shown across the page. The joy stick up/down function can be used to quickly adjust the display<br />
to bring the signal to the center of the screen. Either the stylus “Zoom In” and “Zoom Out” buttons, or the<br />
push buttons to the right of the joy stick can be used to adjust screen resolution.<br />
Pop-up Menus: Additionally, pop-up menus provide more features and selection capability. Tapping the<br />
“Function” menu on the bottom of the screen with the stylus allows the selection of the RTA function. The various<br />
displays of the RTA function are shown in the illustration across the page. Below RTA in the Function menu<br />
is “RTA LEDs.” Selecting this function will provide a display that looks like an LED bar graph that many are so<br />
familiar with. The advantage of this display is that the screen resolution can be adjusted so each LED represents<br />
1dB, 2dB or 3dB. These increments are very useful when equalizing a sound system.<br />
To set the level at the center of the screen (dB Level) and to adjust the dynamic range of the screen (dB per<br />
Division), tap the "Display" menu. Next, from the pop-up menu, select "Set dB Scale." The window shown on<br />
the <strong>IE</strong>-<strong>33</strong> at the bottom of the opposite page shows this feature (the <strong>IE</strong>-<strong>35</strong> is identical). The other functions of<br />
the pop-up menus are covered in detail in other sections of this manual.<br />
Decay: Display speed (averaging time) is controlled by the stylus button titled “Decay.” Decay 1 is the fastest<br />
response time available, with Decay 2 somewhat slower and Decay 3 being the slowest. Decay 3 is intended<br />
for use with pink noise.<br />
Start/Stop Stylus Button: This button stops (freezes) the RTA and SPL displays and starts them again when<br />
tapped a second time.<br />
RTA Display On/Off: The RTA display can be turned on or off using the stylus button illustrated across the<br />
page. Green button indicates “On,” and brown button indicates “Off.”<br />
Average Display On/Off: The Average display (when the Average function is active) can be turned on or off<br />
using the stylus button. Green button indicates “On,” and brown button indicates “Off.” A red button indicates<br />
the Average function is not active.<br />
Memory Stylus Buttons: The <strong>IE</strong>-<strong>33</strong> and <strong>IE</strong>-<strong>35</strong> have 9 “scratch” memories (see the “Memory” section of this<br />
manual for more information on memory and data storage). To store data in a scratch memory, tap the numbered<br />
stylus button. A “snapshot” will be stored. If you are in the Average mode, the average curve will be<br />
stored. When a memory is empty, its stylus button is red. Memories with data in them have green stylus buttons<br />
when being displayed and brown when not being displayed. The last memory stored or activated for display<br />
always has a blue stylus button. Several memories can be displayed simultaneously and each will have its<br />
own color on the display so it can be differentiated.<br />
Preferred Curve: The last stylus button in the row of memory status buttons is the memory status button for<br />
“Preferred Curve.” This is a very powerful function and its use is covered extensively in the section of this manual<br />
titled “RTA -Preferred Curve, Display Weighting, LED Display.”<br />
SPL Readout Stylus Button: Tapping the SPL readout area will cause the analyzer to step through its electrical<br />
measurement modes. This is very useful for looking at voltage levels simultaneously with spectral content.<br />
Obviously, this feature should be used when measuring electrical signal, not acoustic signals through the mic.
<strong>Ivie</strong> <strong>IE</strong>-<strong>33</strong> & <strong>IE</strong>-<strong>35</strong> <strong>Manual</strong><br />
The RTA can display four different resolutions. The RTA samples at a rate of 44 kHz and<br />
collects 2048 data points over a 20 Hz to 20 kHz bandwidth with each frame. When data is<br />
stored, ALL 2048 data points are stored. This allows a recalled memory to be displayed in<br />
any resolution desired by the user.<br />
Max Resolution<br />
240 points<br />
RTA Controls<br />
Options<br />
dB/division display<br />
Memory Snapshot /Average<br />
Sample button (See"Averaging"<br />
& Memory sections of the manual)<br />
dB/Center display<br />
Start/Stop RTA<br />
SPL Response - Fast,<br />
Slow, Peak, Impulse<br />
Frequency Select<br />
Tap to select desired<br />
Resolution display<br />
Options Options<br />
60 - 1/6 Octave bands<br />
Store/Recall Memories<br />
Weighting - A,C, Flat<br />
RTA display On/Off<br />
Average display On/Off<br />
(Used in memory recall)<br />
Real Time Analyzer Controls<br />
30 - 1/3 Octave<br />
bands<br />
Options Options<br />
Options<br />
10 - 1 Octave bands<br />
Tap the "Options"<br />
menu and then<br />
"Set dB Scale"<br />
to bring up the<br />
dB/Center, dB division<br />
window<br />
Preferred Curve Set/Display<br />
dB SPL display<br />
Tap here to select dB<br />
or Voltage readout<br />
Averaging Controls<br />
Tap on screen or use the<br />
mechanical buttons to set<br />
dB/division<br />
dB Center UP/Down<br />
(In increments set by dB/Div)<br />
page 13
Pref. Curve, LED Display, Weighting<br />
Preferred Curve Overlay<br />
page 14<br />
<strong>Ivie</strong> <strong>IE</strong>-<strong>33</strong> & <strong>IE</strong>-<strong>35</strong> <strong>Manual</strong><br />
The Preferred Curve overlay is an <strong>IE</strong>-<strong>33</strong> and <strong>IE</strong>-<strong>35</strong> feature that allows the user to create a target overlay which<br />
can be displayed on the screen. This can be a valuable aid to the equalization process. Users often use a target<br />
curve to contour the frequency response of a system to a desired result.<br />
Creating a Preferred Curve: The preferred, or target curve, is nothing more than a line created by the user<br />
that is overlaid on the screen to help visualize a desired result. To create a Preferred Curve, tap the PE memory<br />
stylus button to the far right of the row of memory stylus buttons. The background on the PE button will change<br />
to white, and the RTA display will move to a special 1/3 octave display with all bars touching the center reference<br />
line. Use the "joystick" rocker button to move the blue 1/3 octave bar right or left to a 1/3 octave you wish<br />
to change. Use the joystick up/down to change the level of the 1/3 octave. Move to the next 1/3 octave and<br />
change that level, and so on. You can create a roll-off target curve or other special spectra targets in this way.<br />
Tap the Preferred Curve stylus button again and the background will turn green, the button text will change to<br />
PT (preferred target), and the preferred target curve overlay will appear on-screen. Tap the button again and the<br />
background will change to buff while the target curve is removed from the display. Tap the button again and it<br />
changes to white as the Preferred Curve entry screen again appears so further editing, if desired, can be done.<br />
Tap the button one more time and it turns green while the Preferred Curve is displayed.<br />
Saving a Preferred Curve: The Preferred Curve you have created can be saved to the analyzer memory very<br />
easily. You can save several Preferred Curves and call them back from memory as needed. To save a<br />
Preferred Curve, tap the main screen Memory button, which will bring up the Memory Management screen.<br />
Note that the default name of the Preferred Curve is "Preferred.ivi." Tap the "Store" button immediately to the<br />
right of the file name and you will see a dialog box that allows you to change the name of the file to something<br />
more descriptive (you can also change the file storage location if you wish). When finished editing, tap "OK" to<br />
store the curve.<br />
Loading a Preferred Curve from Memory: To load a previously stored Preferred Curve from memory, simply<br />
tap the main screen Memory stylus button to bring up the Memory Management screen. Memory slot # 9 is<br />
used for storing and recalling Preferred Curves. Tap the button labeled "Load" for the Preferred Curve memory<br />
location and you will see a dialog that allows you to select the desired preferred curve. Tap "OK" and the curve<br />
will be loaded into the Preferred Curve memory location. Both the <strong>IE</strong>-<strong>33</strong> and <strong>IE</strong>-<strong>35</strong> come with one pre-loaded<br />
Preferred Curve, labeled "Preferred.ivi" that can be loaded into the display. It is a high end roll-off curve used as<br />
a target for large venue sound system EQ.<br />
LED Display: Many users are familiar with the LED display of <strong>Ivie</strong>'s <strong>IE</strong>-30A analyzer. To have the <strong>IE</strong>-<strong>33</strong> or<br />
<strong>IE</strong>-<strong>35</strong> emulate the <strong>IE</strong>-30's LED display, tap the "Function" pop-up menu at the bottom of the main screen and<br />
choose "RTA LEDs." The RTA display changes to "LEDs.” Tip: The LED display can be useful in interpreting<br />
amplitude information on the analyzer screen. By setting the dB scale to 5 dB/division each LED represents one<br />
dB of amplitude. By setting 10 dB/division each LED represents 2 dB of amplitude, and by setting 15 dB/division,<br />
each LED represents 3 dB of amplitude change.<br />
SPL Weighting and the RTA Display: Some users prefer to see the normal weighting filters that are applied to<br />
SPL measurements also applied to the visual spectrum of the on-screen RTA. The <strong>IE</strong>-<strong>33</strong> and <strong>IE</strong>-<strong>35</strong> allow you to<br />
choose whether or not the RTA display will show an unweighted display or a weighted display. To apply weighting<br />
filters to the RTA display, tap on the "Options" pop-up menu at the bottom of the screen and select "RTA<br />
Weighting." Whatever weighting filter is selected for the SPL meter when in RTA mode (the SPL meter is in the<br />
small windows in the lower right of the screen) will then be applied to the RTA display. Unchecking (by again<br />
tapping) this selection will remove weighting from the RTA display.
<strong>Ivie</strong> <strong>IE</strong>-<strong>33</strong> & <strong>IE</strong>-<strong>35</strong> <strong>Manual</strong><br />
Entering a Preferred Curve Overlay<br />
(Or how to draw a curve on your screen without using a grease pencil)<br />
The Preferred Curve Overlay is a valuable aid to the equalization process. It is the electronic<br />
equivalent of drawing a Preferred Cuve on the RTA screen with a grease pencil. The Preferred<br />
Curve then provides you with an on-screen target equalization curve.<br />
Step 1- Tap on Red "PE"<br />
(Preferred Empty).<br />
The Preferred Curve entry<br />
screen will appear.<br />
Selected frequency<br />
Relative amplitude and<br />
Frequency readout<br />
The RTA display can be set to an LED<br />
style display using the "Function" menu<br />
5 dB/div = 1 dB/LED<br />
10 dB/div = 2 dB/LED<br />
15 dB/div = 3 dB/LED<br />
Options<br />
Step 2 - Use the Joystick<br />
Left/Right to select a<br />
frequency & Up/Down to set<br />
the amplitude until curve<br />
entry is complete.<br />
Step 3 - Tap on the "PT"<br />
button to display the<br />
Preferred Curve Overlay.<br />
Use the Memory button to Clear,<br />
Store, & Load Preferred curves.<br />
Step 4 - The Preferred<br />
Curve Overlay is now<br />
displayed. To turn off the<br />
display, tap on the green PT<br />
button. To Edit the curve or<br />
turn on the display tap on<br />
the buff colored PT and then<br />
the white PT button.<br />
Options Options Options<br />
Step 5- Tap on Memory<br />
and store it for future use.<br />
RTA LED Display Applying SPL Weightings to the RTA Display<br />
Options<br />
Pref. Curve, LED Display, Weighting<br />
The SPL weighting filters "A" & "C" may be applied to the<br />
RTA display by using the "Options" menu.<br />
No Weighting Weighting Applied<br />
Options Options<br />
page 15
RTA: Peak Curves, Freq. Detection<br />
Peak Hold Curves<br />
page 16<br />
<strong>Ivie</strong> <strong>IE</strong>-<strong>33</strong> & <strong>IE</strong>-<strong>35</strong> <strong>Manual</strong><br />
The <strong>IE</strong>-<strong>33</strong> and <strong>IE</strong>-<strong>35</strong> will display peak information in addition to real time information in all of the display modes,<br />
Octave through Maximum Resolution. The peak curve is shown in violet for the Octave, 1/3 Octave and 1/6<br />
Octave displays, and in white for the Maximum Resolution display screen, as shown in the illustration across the<br />
page. The peak curve data represents the highest levels that have been reached across the spectrum. In addition<br />
to peak data, real time information is also displayed.<br />
To activate the Peak Hold function and display the peak hold curve, tap the pop-up “Options” menu and select<br />
"Peak/Hold Curve." You can toggle through the various display formats (Octave to 1/3 Octave, etc.) while the<br />
Peak Hold function is active. However, when selecting different display formats, the peak hold information will<br />
not be preserved from display to display. Instead, it will initialize and begin again as though it had just been activated.<br />
To turn the Peak Hold function off, select "Peak/Hold Curve"" again. Note: If you store spectral data in<br />
a scratch memory when the Peak Hold function is activated, real time data, not the peak curve, will be stored.<br />
Frequency and Amplitude Detection<br />
Several different modes of frequency and amplitude detection are provided by the <strong>IE</strong>-<strong>33</strong> and <strong>IE</strong>-<strong>35</strong>. All of them,<br />
including the Frequency Detect indicator, operate in all resolution settings, Octave, 1/3 Octave, 1/6 Octave,<br />
Maximum Resolution and LF Zoom.<br />
For real time data, a frequency detect cursor can be activated which constantly searches the spectra and displays<br />
the frequency of the highest level found in the spectrum. Real time data, or peak hold data, can also be<br />
frozen using the "Stop" stylus button, and then be interrogated for frequency information using a provided cursor,<br />
as demonstrated in the illustration across the page. The cursor can be moved using the stylus or the joy stick.<br />
Additionally, any recalled and displayed memory can be interrogated for frequency information in the same<br />
manner.<br />
Frequency Detect: To activate the Frequency Detect mode (especially useful when searching for feedback frequencies),<br />
tap the “Options” pop-up menu and select "Freq. Detect." The Frequency Detect indicator will appear<br />
on screen and begin to search for and identify the frequency registering the highest level. To turn off the<br />
Frequency Detect indicator, select "Freq. Detect" again.<br />
RTA Cursor: To activate the RTA Cursor, first tap the stylus button on the bottom left labeled "Stop." This will<br />
"freeze" the RTA display and the bar below the SPL readout will change from green to red. Next, press the left<br />
or right joy stick. The frequency cursor (a red + in Max. Res. or a green bar in Octave, 1/3 Octave or 1/6<br />
Octave) will appear on the curve. The cursor can be moved left or right using the left and right controls of the<br />
joy stick, or by using the stylus to tap, and thereby select, a new position. As it moves, frequency and amplitude<br />
will be indicated in the SPL readout window and all areas of interest can be interrogated. To turn off the RTA<br />
Frequency Cursor, tap the "Start" stylus button to return the analyzer to its real time display.<br />
Peak Cursor: When the "Peak Hold Curve" is being displayed, peak hold data can be interrogated using the<br />
Peak Cursor. To accomplish this, first turn on the Peak Hold Curve by selecting it from the ”Options” pop-up<br />
menu. Next, tap the "Stop" stylus button. When the display has been stopped, select "Peak Cursor" from the<br />
“Options” menu. The joy stick, or stylus, can then be used to move left or right along the spectrum to interrogate<br />
the Peak Curve for frequency and amplitude information. Selecting "Peak Curve" again turns off this function.<br />
Memory Cursor: This function works identically to the Peak Cursor. To activate the Memory Cursor, tap a<br />
memory stylus button to recall the memory of interest. With the memory display on the <strong>IE</strong>-<strong>33</strong>, or <strong>IE</strong>-<strong>35</strong> screen,<br />
tap the “Options” pop-up window and select "Memory Cursor." The Memory Cursor will appear on the curve.<br />
The cursor can be moved left or right along the curve by using the left and right controls of the joy stick, or the<br />
stylus.. As it moves, frequency and amplitude will be indicated. To turn off the Memory Cursor, select "Memory<br />
Cursor" from the “Options” menu again.
<strong>Ivie</strong> <strong>IE</strong>-<strong>33</strong> & <strong>IE</strong>-<strong>35</strong> <strong>Manual</strong><br />
Peak Hold & RTA Curves RTA Curve with Frequency<br />
Detection display "On"<br />
RTA Cursor<br />
To display the cursor, tap the<br />
"Start/Stop" button to freeze the<br />
display then use the Left/Right<br />
Joystick to position the cursor.<br />
Only the cursor selected in the<br />
menu will be displayed. If the<br />
Peak Cursor is not selected, the<br />
RTA cursor will be shown.<br />
Options<br />
RTA Curve<br />
Options<br />
Options<br />
RTA: Peak Curves, Freq. Detection<br />
Options<br />
There are many display options in<br />
the "Max Res" mode. Along with<br />
the RTA curve, the Peak Hold<br />
curve can also be displayed.<br />
TO CLEAR THE "PEAK HOLD"<br />
curve tap the "Clear Button."<br />
DISPLAY of Cursor Frequency and<br />
Level.<br />
RTA/Peak Hold Curves, Stopped<br />
with Peak Hold Cursor diplayed.<br />
Options<br />
Options<br />
The "Frequency Detect" will<br />
show the frequency of the FFT<br />
Bin in which the highest<br />
amplitude occurs. This is<br />
extremely helpful when using a<br />
parametric equalizer to EQ<br />
feedback frequencies.<br />
RTA/Peak Hold Curves, Stopped<br />
with RTA Cursor diplayed.<br />
Options<br />
page 17
RTA: Memory Functions<br />
Memory Functions<br />
page 18<br />
<strong>Ivie</strong> <strong>IE</strong>-<strong>33</strong> & <strong>IE</strong>-<strong>35</strong> <strong>Manual</strong><br />
The <strong>IE</strong>-<strong>33</strong> and <strong>IE</strong>-<strong>35</strong> memory systems provide all the tools necessary to save various types of files to memory,<br />
rename files, load files from memory, examine memory data, and subtract one curve from another. Most memory<br />
system operations are performed using the memory stylus buttons and the memory management screen.<br />
Memory Control Buttons: The memory stylus buttons are located immediately below the RTA display screen.<br />
The row of twelve buttons allows both control of what is viewed on-screen, and the ability to store data in<br />
"scratch memories." The far left "R" button toggles "on" or "off" the real time display. The "A" stylus button<br />
controls the display of the Average curve. Stylus buttons 1 - 9 alternately store, remove from display, and<br />
restore to display the contents of the nine Scratch memories. The "PE" stylus button controls "Preferred" or<br />
"Target Curve" functions.<br />
Stylus Button Colors: If a stylus button is red, there is nothing stored in the memory or display location associated<br />
with the button. If the button is green, there is data present and it is being displayed. Blue is identical to<br />
green, that is, there is data present and it is being displayed. However, blue also indicates that this is the last<br />
memory location to be manipulated. This blue color is very useful in keeping memories straight, especially when<br />
using the thumb-push button instead of the stylus buttons to store data. Finally, if a button is buff colored, there<br />
is data stored in that memory location, but not displayed on-screen (tapping a buff stylus button will display the<br />
data associated with that button and change the button color to blue).<br />
Scratch Memories: Scratch memories are "scratch pad-type" storage memories where you can temporarily<br />
store curve data until you decide to rename and store the data permanently. You can store the RTA data you<br />
are observing to a scratch memory by tapping a scratch memory stylus button, or you can depress the "thumb<br />
button" on the side of the iPAQ, or the Axim. Using the thumb button is convenient and provides automatic,<br />
sequential storage of data in scratch memories 1 through 9.<br />
Memory Management: Tap the "Memory" stylus button to access the memory management screen. The memory<br />
management screen allows you to store, load, and clear files from scratch memories, Preferred Curve memory,<br />
subtraction memory, and peak memory. Select a memory location you wish to store and tap the adjacent<br />
"Store" button. You will be prompted to provide a more descriptive name for the file you are about to store. You<br />
can also change the location to which the file will be stored, if you wish. Tap "OK" and the contents of the<br />
scratch memory will be stored under the name and in the location of your choice. To clear a scratch memory<br />
with or without storing it, tap the adjacent "Clear" button. A stored curve data file may be loaded into a scratch<br />
memory location by tapping the "Load" button, selecting the file to be loaded, and tapping on the file name.<br />
Stored Peak and Subtraction data files may also be loaded into scratch memories.<br />
Subtract Feature: The <strong>IE</strong>-<strong>33</strong> and <strong>IE</strong>-<strong>35</strong> provide a powerful function which allows the user to subtract one curve<br />
from another. A stored scratch memory curve can be subtracted from the real time display, or one scratch memory<br />
curve can be subtracted from another, or from an Average curve. Tap the "Subtract" stylus button to access<br />
the subtract control screen. From here, choose which spectrum you wish to subtract from another. Upon tapping<br />
"S1 - S2," the RTA display returns with a "0" center reference and yellow RTA bars. You are viewing the<br />
one spectrum subtracted from the other. To return to normal RTA, tap the Subtract stylus button, then "Cancel."<br />
Peak Storage: When displaying the "Peak Hold" curve in the RTA, you can open the Memory Manager and tap<br />
"Store Peak" to store this peak information in the peak spectrum scratch area. From here you can rename it<br />
and store it permanently. Stored peak curve data can be loaded into any of the nine scratch memories via the<br />
Memory Manager. Just select a scratch memory and tap "Load." Next, select the peak memory to be loaded.<br />
Memory File Format: Data stored in files can be moved to the PC using the standard Microsoft ActiveSync<br />
software provided with the iPAQ or Axim. The analyzers always store data in full resolution of 2048 data points<br />
across the spectrum. Using <strong>Ivie</strong>'s supplied "<strong>Ivie</strong>XLS" software and Microsoft Excel, you can display, manipulate,<br />
and print data. The file format for stored data is a file header and four columns of ASCII text and number characters.<br />
The 4 columns are: 1: Hz (label), 2: Datum frequency, 3: dB (dB label), 4: Amplitude at that frequency.
<strong>Ivie</strong> <strong>IE</strong>-<strong>33</strong> & <strong>IE</strong>-<strong>35</strong> <strong>Manual</strong><br />
Store a curve to memory<br />
Step 1 - Tap an empty Scratch<br />
memory location 1 - 9 (colored in<br />
Red). The curve will appear on the<br />
screen and the Scratch memory<br />
background color will turn Blue<br />
indicating it is now filled and being<br />
displayed.<br />
Tap the Blue Scratch memory to<br />
remove the stored curve from the<br />
display. The background color will<br />
turn to Buff indicating that the<br />
memory is filled but not presently<br />
displayed.<br />
Re-name a memory<br />
from "Scratch" to a more<br />
descriptive name and<br />
tap on "OK."<br />
Step 1 - Tap on "Options" then "Memory<br />
Cursor."<br />
Step 2 - Tap on "Stop."<br />
Step 3 - Turn RTA display On/Off as desired.<br />
Step 4- Use Left/Right Cursor to select the<br />
frequency.<br />
Options<br />
Memory Cursor<br />
Options<br />
Step 2 - To store a Scratch memory to the<br />
main memory, tap on the "Memory" control to<br />
bring up the memory management screen.<br />
From this screen you can "Store" a Scratch memory to<br />
main memory or "Load" a memory from main back into<br />
a Scratch memory. Preferred, Peak and Subtraction<br />
memories can also be "Stored" and "Loaded."<br />
dB<br />
Freq<br />
Memory #3 being displayed<br />
Options<br />
Step 1 - Tap<br />
on the yellow<br />
"Subtract"<br />
control.<br />
Step 2 - Select two<br />
sources or<br />
spectrums for<br />
comparison:<br />
Scratch Memory,<br />
Preferred Curve,<br />
RTA Display or<br />
Average and then<br />
Tap "S1 - S2."<br />
RTA: Memory Functions<br />
Buff colored 1, 2, 4 & 5 = Curves are<br />
stored in these memories but they are<br />
not currently being displayed.<br />
Red colored 6, 7, 8 & 9 = These<br />
Scratch memories are empty and<br />
available for curve storage.<br />
Red "PE" Preferred curve not stored.<br />
Blue = Scratch memory #3 displayed.<br />
Red "A"= No Average curve is stored.<br />
Green "R" = RTA curve is displayed.<br />
Tap on a memory file to<br />
move it into a Scratch<br />
memory so it can<br />
displayed.<br />
Subtract / Display Two Memories<br />
Options Options<br />
Step 3 - The result will be displayed in<br />
yellow on the screen. To exit this mode, tap<br />
on "Subtract" and then "CANCEL."<br />
page 19
NIC and (F)STC Measurements<br />
NIC Measurements<br />
page 20<br />
<strong>Ivie</strong> <strong>IE</strong>-<strong>33</strong> & <strong>IE</strong>-<strong>35</strong> <strong>Manual</strong><br />
Sound transmission field testing of operable walls and field partitions is almost exclusively done using ASTM<br />
E<strong>33</strong>6 as the standard. The <strong>IE</strong>-<strong>33</strong> and <strong>IE</strong>-<strong>35</strong> are capable of making Noise Isolation Class (NIC) measurements.<br />
NIC measurements are normally specified rather than Field Sound Transmission Class (F)STC measurements<br />
because they are faster, easier, and therefore, less expensive to make. Field Sound Transmission Class<br />
({F}STC) measurements require RT60 information for the calculation, as well as receiving room absorption in all<br />
sixteen 1/3 octave bands of interest. Both the <strong>IE</strong>-<strong>33</strong> and the <strong>IE</strong>-<strong>35</strong> are capable of making RT60 measurements<br />
(if the optional RT60 software module is purchased) as well as measuring receiving room absorption in the<br />
required sixteen 1/3 octave bands. However, since RT60 measurement capability is an option, not a standard<br />
feature, <strong>Ivie</strong> has chosen not to integrate (F)STC measurement measurement capability into the <strong>IE</strong>-<strong>33</strong>, or <strong>IE</strong>-<strong>35</strong>,<br />
measurement suite. The following instructions are therefore limited to the theory of NIC measurements and<br />
making NIC measurements.<br />
NIC is a single-number acoustical rating of sound isolation between two different spaces separated by a sound<br />
barrier. A typical measurement example would be determining the sound isolation provided by a wall or movable<br />
partition separating two rooms. To make the measurement, an omni-directional sound source would be<br />
placed in the Source Room to energize it with pink noise. Averaged (power averaged), 1/3 octave RTA spectrum<br />
measurements would then be made on both sides of the wall (Source Room and Receiving Room) and<br />
each room average would be stored to separate memory locations. The NIC calculation would begin as the<br />
stored spectrum of the Receiving room is subtracted from the stored spectrum of the Source Room to create a<br />
Transmission Loss (TL) curve.<br />
The NIC rating would then be determined by comparing and shifting the TL curve relative to the standard NIC<br />
contour such that the TL curve is never more than 8 dB below the NIC contour in any 1/3 octave band; and the<br />
sum of the deficiencies below the contour over the 16, 1/3 bands, does not exceed 32 dB. Once the TL curve is<br />
shifted to meet these criteria, the NIC rating is determined by the value of the NIC contour at 500 Hz. Once the<br />
Source Room and Receiving Room curves are stored, the curve fitting and NIC calculation are all done automatically<br />
by the <strong>IE</strong>-<strong>33</strong>, or <strong>IE</strong>-<strong>35</strong>. Only a few taps of the stylus are required to complete the measurement and display<br />
the results.<br />
The step-by-step process for making an NIC measurement is demonstrated by the illustrations on the opposite<br />
page. Note: Of particular interest in NIC measurements is the requirement for power averaged data. The <strong>IE</strong>-<br />
<strong>33</strong> and <strong>IE</strong>-<strong>35</strong> “default” operating mode is “Arithmetic Average,” so “Power Average” will need to be selected.<br />
Real Time NIC Measurements<br />
This is a very useful diagnostic tool offering, unique to <strong>Ivie</strong> instrumentation. This mode allows the user to compare<br />
the stored average curve in the Source Room to real time data in the Receive Room, thus providing a running<br />
calculation of NIC in real time. While in the Receive Room, the microphone can be moved to any position<br />
around the sound barrier to find "sound leaks", weak isolation areas, strong isolation spots etc. Because the<br />
NIC curve and calculated number are continuously updated in real time, it is easy to quickly compare different<br />
areas, thereby determining deficiencies relative to location.
<strong>Ivie</strong> <strong>IE</strong>-<strong>33</strong> & <strong>IE</strong>-<strong>35</strong> <strong>Manual</strong><br />
How make an NIC measurment<br />
Step 1- Under the "Function" menu select "RTA".<br />
Step 2- Make certain the Average mode is set to "Average-P"<br />
(File>Preferences>Power Average).<br />
Step 3- Turn on the sound source. In the Source room, go to a<br />
position one meter away from the wall and press the "Average-P"<br />
button. Move along the wall as samples are taken. Press the<br />
"Pause" button when you reach the end of the wall.<br />
Step 4- Store the Average to Memory #1 and then press the<br />
"Count=" button to clear and reset the Average.<br />
Step 1- Under the "Function" menu select "RTA"<br />
Step 1- Store real time spectrum in<br />
memory #1.<br />
Step 2 - Press the "Subtract/STC"<br />
button.<br />
Step 3 - Select memory #1 in the "S1"<br />
column and "R" in the "S2" column.<br />
Step 4 - Press the (F)STC/NIC(S1-S2) button.<br />
Source Room<br />
Omnidirectional<br />
Sound Source<br />
Store RTA averaged<br />
spectrum in Memory #1<br />
Receiving Room<br />
Measurement<br />
Points @1 Meter<br />
from the wall<br />
Store RTA averaged<br />
spectrum in Memory #2<br />
Step 5- In the Receiving room, go to a position one meter away from the wall and press the "Average-P" button. Move<br />
along the wall as samples are taken. Press the "Pause" button when you reach the end of the wall.<br />
Step 6- Store the Average to Memory #2 and then press the "Count=" button to clear and reset the Average.<br />
Step 7- Press the "Subtract/STC" button to bring up the Subtract/STC screen.<br />
Step 8 - In the "S1" column select 1(which is memory #1) . In the "S2" column select 2 (which is memory #2).<br />
Now press the (F)STC/NIC(S1-S2) button.<br />
Step 9 - To return to the RTA screen press the "Subtract/STC" button and then the "Cancel" button.<br />
Store 2 Measurements and<br />
press the "Subtract/STC button<br />
Select the two memories<br />
and press this button<br />
REAL TIME NIC or Sniffer Mode<br />
Display the NIC Curve<br />
and Value<br />
The <strong>IE</strong>-<strong>33</strong> can perfom "Real Time" NIC measurements. The real time spectrum measurement in the Receiver room is<br />
subtracted from the spectrum of the Source room stored in memory #1. This mode is unique to <strong>Ivie</strong>. You can use it<br />
as a "sniffer" to help locate leakage paths.<br />
Options<br />
Options<br />
NIC and (F)STC Measurements<br />
Options<br />
page 21
RTA: Average Mode<br />
Average Mode<br />
page 22<br />
<strong>Ivie</strong> <strong>IE</strong>-<strong>33</strong> & <strong>IE</strong>-<strong>35</strong> <strong>Manual</strong><br />
The <strong>IE</strong>-<strong>33</strong> and <strong>IE</strong>-<strong>35</strong> Average Mode offer very powerful features that allow you to create continuous or triggered<br />
averages of various types, as well as select the type of average that best suits your measurement.<br />
Continuous Average Mode<br />
In the RTA mode, tap on the “Average-A” stylus button. The default condition for the stylus button below the<br />
Average button is “Cont.”, which indicates that you will be starting with a continuous average. When you tap the<br />
Average-A button, the button text changes to “Count = X," where "X" is the number of samples so far collected.<br />
You will see the sample number increment as the number of automatically collected data samples increases.<br />
A blue line will immediately form on the RTA screen, which is the graphic representation of the average that is<br />
being collected. The more samples collected, the slower this average display will change as short duration<br />
acoustic events are encountered.<br />
In Continuous Mode, the data sample collection can be paused by tapping Pause/Resume stylus button, or by<br />
pressing the mechanical Thumb Button on the side of the iPAQ or Axim. Tapping the stylus button again, or<br />
pressing the Thumb Button again, continues the sample taking process.<br />
You may switch the screen presentation between 1/1, 1/3, 1/6 octave and Max Res at any time during an<br />
Average measurement. However, doing so will reset the data sample counter to zero and start the averaging<br />
process over again.<br />
Triggered Average Mode<br />
Tapping the “Cont.” stylus button will switch it to “Trigger.” In this mode, data samples for averaging are taken<br />
only when the user manually triggers a sample. Triggering a sample can be done by tapping the “Add” stylus<br />
button, or by using the mechanical Thumb Button on the side of the iPAQ or Axim. Each time a data sample is<br />
added by triggering a sample, the sample count on the Average button will increment by one.<br />
You can manually clear an Average Curve and reset the data sample counter to zero at any time by tapping the<br />
“Clear” button. To exit the Average mode tap the “Count-X” stylus button.<br />
Average Type Selection: The <strong>IE</strong>-<strong>33</strong> and <strong>IE</strong>-<strong>35</strong> Average Mode offer the power of two types of averaging. The<br />
Arithmetic Average (Average-A) does straight arithmetic averaging. This type of average is probably best when<br />
you are viewing the RTA screen while doing active equalization or other dynamic spectral adjustments. The<br />
user may switch the averaging mode to “Power Average (Average-P), which is probably most useful in measurements<br />
where the total power is more important for measurements such as transmission loss, or noise isolation.<br />
Switching from Average-A to Average-P is done by tapping the "File" pop-up menu. Select "Preferences" next,<br />
and from that pop-up menu, select either Power Average or Arithmetic Average.<br />
Viewing an Average Curve: While the average is being taken, the blue average line is seen in the RTA screen.<br />
To see this line more clearly, you can temporarily remove the real-time data from the display. This is done by<br />
tapping the green “R” button immediately below the RTA display (see figure on the opposite page). Don’t forget<br />
to turn the real-time display back on when you’re done . . . It’ll save you a call to <strong>Ivie</strong> Tech Support!<br />
Storing and Loading an Average Curve: When an Average Curve is displayed on the RTA screen, it is what<br />
will be stored when you choose to store a curve. With this in mind, an Average Curve is stored in the same way<br />
any other spectrum is stored. Simply select an empty scratch memory location (red stylus buttons indicate<br />
empty memory locations) and tap it. The Memory Manager ("Memory" stylus button) allows the storing of any<br />
scratch memory. Similarly, stored curves can be loaded into any standard scratch memory location by opening<br />
the Memory Manager and selecting “Load” for any of the scratch memory locations.
<strong>Ivie</strong> <strong>IE</strong>-<strong>33</strong> & <strong>IE</strong>-<strong>35</strong> <strong>Manual</strong><br />
Continuous Mode Tigger Mode<br />
To Select Averaging Method<br />
1 - Tap "File."<br />
2 - Tap "Preferences."<br />
3 - Tap either "Power Average."<br />
or "Arithmetic Average."<br />
Green = Display On<br />
Options<br />
Step 1 - Select either the Continuous<br />
(Cont.) or Trigger mode for<br />
Averaging.<br />
The Continuous mode will<br />
automatically take sample after<br />
sample until the "Pause/Resume"<br />
control is pressed.<br />
The Trigger mode will take only one<br />
sample each time the "Add" control is<br />
pressed or the Thumb button on the<br />
side of the <strong>IE</strong>-<strong>33</strong> is pressed.<br />
Step 2 - Tap on the "Average-P"<br />
control to enter into Average mode.<br />
Options Options<br />
Real time "R" and Average<br />
"A" displays turned on.<br />
Options<br />
Step 3 - The "Average" display will be replaced with a "Count=X" display,<br />
with X= the number of samples taken. In the Trigger mode the Count will<br />
be incremented with each tap of the "Add" control. In the Continuous<br />
mode the Count will be controlled by the "Pause/Resume" control.<br />
Step 4 - Store the Average curve by selecting any un-used scratch<br />
memory. If you wish to store the real-time curve instead of the Average<br />
curve, turn off the Average curve display before pressing the Scratch<br />
Memory Store control.<br />
Tap "Clear" to Clear the Average curve and reset the Count to zero.<br />
Tap "Count" to Exit the Average mode.<br />
Average Curve<br />
Buff = Disp Off<br />
Green = Disp On<br />
With Average<br />
curve displayed,<br />
press an empty<br />
(red color) Scratch<br />
Memory to store.<br />
RTA: Average Mode<br />
Real time "R" display Off<br />
Average "A" display turned on.<br />
Options<br />
page 23
RTA: Noise Criteria & Noise Rating<br />
Noise Criteria (NC) and Noise Rating (NR) Measurements<br />
page 24<br />
<strong>Ivie</strong> <strong>IE</strong>-<strong>33</strong> & <strong>IE</strong>-<strong>35</strong> <strong>Manual</strong><br />
The <strong>IE</strong>-<strong>33</strong> and <strong>IE</strong>-<strong>35</strong> are equipped to make quick, accurate Noise Criteria (NC) and Noise Rating (NR) measurements.<br />
NC and NR are measurement protocols which allow the consultant or contractor to quantify the ambient,<br />
or quiescent noise level of the room being measured. Many rooms that are designed by consultants are<br />
designed to an NC or an NR specification, and NC/NR measurements are designed to confirm or certify that the<br />
acoustic and mechanical design meet the required “level of quiet.”<br />
Making an NC measurement with the <strong>IE</strong>-<strong>33</strong>, or <strong>IE</strong>-<strong>35</strong>, is very simple. From the RTA screen, tap on the “Options”<br />
pop-up menu at the bottom of the screen. Then tap on “NC” to activate the NC measurement screen. The RTA<br />
screen then automatically configures for NC measurements. You will note that the <strong>IE</strong>-<strong>33</strong> and <strong>IE</strong>-<strong>35</strong> switch to the<br />
one-octave display and the RTA/SPL weighting revert to “Flat.” Both of these settings are required for NC measurements.<br />
You will also notice that the “NC Overlay Contours” are shown on the screen. These lines represent<br />
the spectral contours that denote the various NC levels.<br />
The NC contours can be “manually read” to determine the NC level. Making certain that there are no extraneous<br />
noise sources in the room (the room should be as quiet as it can be), activate the NC screen. Determine<br />
the NC line that is closest to, but not touched by, the octave RTA display bars. This line represents the NC level<br />
of the noise in the room or space being measured.<br />
Note: NC levels are read in 5 dB increments. For example, there is technically no such thing as an NC 47.<br />
Only NC 45 or NC 50. Many individuals, as a matter of practice, refer to NC numbers between the 5 dB levels,<br />
and this can be useful, but it is not technically correct.<br />
The <strong>IE</strong>-<strong>33</strong> and <strong>IE</strong>-<strong>35</strong> make the job easier. Instead of interpreting the movement of the octave bars, you can<br />
observe the NC number which your unit calculates and displays in the lower-right SPL window. This number will<br />
show the NC in dB increments, though the “official” measurements are in 5 dB increments. To make a “correct”<br />
NC measurement using the NC numbers calculated by the <strong>IE</strong>-<strong>33</strong>, or <strong>IE</strong>-<strong>35</strong>, one need only round up to the nearest<br />
5 dB increment.<br />
Another Note: The maximum NC number in the NC protocol is NC 65. Any level above that does not fit in<br />
the range of NC measurement. If the noise level of the space being measured is above NC 65, the calculated<br />
NC number will display “NC++”.<br />
NR Measurements are made in exactly the same way NC measurements are made, but the NR Overlay<br />
Contours are slightly different. Neither NC nor NR is better than the other; they are just slightly differing standards.<br />
In various regions and countries, one is favored over the other. The consultant or contractor needs to be<br />
able to measure to both standards in order to meet the needs of both specifications.<br />
To activate the NR measurement screen, go to the “Options” pop-up menu and select “NR.” From that point, the<br />
instructions for NC and NR are pretty much interchangeable.<br />
NC & NR Averaging: It may be useful to use an averaged octave spectrum for making NC or NR measurements.<br />
To do this, activate the NC or NR screen, then tap the Average button. Activate the Continuous Average<br />
button (see instructions for Averaging). The average function will begin taking samples and create a blue average<br />
spectrum line. When the Continuous Average function is active, NC and NR measurements are being calculated<br />
from the relationship of the average octave display (blue line) to the NC or NR Overlay Contours.<br />
If you switch off averaging, the calculated NC or NR number will revert to making its calculations from the realtime<br />
octave bars.
<strong>Ivie</strong> <strong>IE</strong>-<strong>33</strong> & <strong>IE</strong>-<strong>35</strong> <strong>Manual</strong><br />
Step 1 - While in the RTA<br />
Function, under the "Options"<br />
menu select "NC". Don't worry<br />
about the RTA weighting as it will<br />
automatically be set to "FLAT."<br />
Options<br />
Options<br />
Making a Noise Criteria (NC) Measurement<br />
Step 1 - While in<br />
the RTA Function,<br />
under the "Options"<br />
menu select "NR".<br />
Don't worry about<br />
the RTA weighting<br />
as it will<br />
automatically be set<br />
to "FLAT."<br />
RTA: Noise Criteria & Noise Rating<br />
Options<br />
Step 2 - Read the NC value<br />
in the SPL window.<br />
Note: Any NC value over 65<br />
will be displayed as NC++.<br />
Step 2 - Read the NR<br />
value in the SPL window.<br />
Note: Any NR value over<br />
65 will be displayed as<br />
NR++.<br />
Options<br />
Should you desire, you can<br />
activate the averaging function and<br />
then the NC will be calculated from<br />
the Average curve.<br />
Making a Noise Reduction (NR) Measurement<br />
Options Options Options<br />
Should you desire, you can<br />
activate the averaging<br />
function and then the NR will<br />
be calculated from the<br />
Average curve.<br />
page 25
Sound Pressure Level (SPL)<br />
Sound Level Measurement<br />
Introduction<br />
The decibel (dB) scale has been adopted internationally for use with sound level meter testing. The scale<br />
begins at a reference of 0 dB in sound pressure level (0 dB SPL) which corresponds to the smallest sound that<br />
can be heard by a healthy human ear, and is equal to 2µN/m2, or perhaps more commonly, 20µPa. To get a<br />
better idea of relative sound levels, consider the following: Quiet outdoors in the country would measure around<br />
10dB, a very soft whisper about 30dB and average conversation around 70dB. An automobile horn would weigh<br />
in at approximately 80dB, a jackhammer around 100dB and a small aircraft engine roughly 120dB. The threshold<br />
of pain is about 140dB.<br />
When studying sound level measurements, it is of major importance to understand the response characteristics<br />
of the human ear. Our ears do not respond equally to all the frequencies of the audio spectrum - in other words,<br />
they are not "flat" in their response. To further complicate matters, the response characteristics of human ears<br />
change with different SPL's. At relatively quiet SPL's, our ears attenuate high frequency sounds to some<br />
degree, and drastically attenuate low frequency sounds. As SPL's increase, our ears get more efficient at low<br />
frequencies and their response to sound becomes more "flat," although they never achieve a totally "flat"<br />
response. Following is a set of curves which approximate the "A" and "C" curves, or the hearing response of<br />
human ears. The "A" curve shows how ears hear, or perceive sound at low SPL's, while the "C" curve shows<br />
how we hear at relatively high SPL's.<br />
Level<br />
in dB<br />
0<br />
-10<br />
-20<br />
-30<br />
-40<br />
-50<br />
20 50 100 500 1K 5K 10K 20K<br />
Frequency in Hz<br />
<strong>Ivie</strong> <strong>IE</strong>-<strong>33</strong> & <strong>IE</strong>-<strong>35</strong> <strong>Manual</strong><br />
These curves have been integrated into sound level meters for testing sound levels. "A" weighted (dBA) measurements<br />
use the "A" curve above, "C" weighted (dBC) use the "C" curve above, and "Flat" (dB SPL) measurements<br />
use no weighting at all.<br />
page 26
<strong>Ivie</strong> <strong>IE</strong>-<strong>33</strong> & <strong>IE</strong>-<strong>35</strong> <strong>Manual</strong><br />
Make an SPL Measurement<br />
Step 1 -<br />
Step 2 -<br />
Step 3 -<br />
Set the <strong>IE</strong>-<strong>33</strong> for "Slow" response.<br />
Set the <strong>IE</strong>-<strong>33</strong> for "A" Weighting.<br />
Read the SPL dB(A) in the SPL window.<br />
Typically "A" Weighting is used because it approximates how humans perceive sound .<br />
The "Slow" Response is good for measuring sound levels of a continuous nature.<br />
A<br />
Options<br />
In the "Peak Hold" mode the SPL meter<br />
will capture and hold the highest SPL<br />
reading. The "RESET" control must be<br />
tapped to clear and reset the SPL display<br />
for subsequent readings.<br />
A<br />
Sound Pressure Level (SPL)<br />
Sound Pressure Level in<br />
dB SPL with "A"<br />
Weighting Filter Applied.<br />
Tap to select different Weighting Filters to<br />
be applied to the SPL Meter.<br />
Tap to select different detector response<br />
times for the SPL Meter.<br />
page 27
Sound Pressure Level (SPL) Monitor<br />
Making SPL Measurements<br />
page 28<br />
<strong>Ivie</strong> <strong>IE</strong>-<strong>33</strong> & <strong>IE</strong>-<strong>35</strong> <strong>Manual</strong><br />
An <strong>IE</strong>-<strong>33</strong>, or <strong>IE</strong><strong>35</strong>, as shown on the opposite page, can make all the SPL measurements required by U.S. and<br />
international standards, including A, C and unweighted SPL measurements. In addition to weighting, various<br />
detectors, again specified by U.S. and international standard, can be selected for SPL measurement. These<br />
detectors include Fast, Slow, Peak and Impulse. The Fast and Slow detectors are true RMS with different averaging<br />
times. Peak is a true peak detector, and quite fast. Impulse is a combination of an extremely fast peak<br />
detector, followed by an RMS buffer and is intended for measurement of extremely short duration phenomena.<br />
The Slow detector, in combination with A weighting, is normally used for making sound level measurements<br />
related to noise associated with hearing damage. OSHA and other regulatory SPL measurements are normally<br />
written around A weighted, Slow. It has been determined that high A weighted sound levels are more damaging<br />
to human hearing than C or unweighted levels.<br />
System Calibration for OSHA Measurements<br />
OSHA measurements generally require equipment that meets minimum specification standards - at least an<br />
ANSI Type II sound level meter, for example. The <strong>IE</strong>-<strong>33</strong>, or <strong>IE</strong>-<strong>35</strong>, with its supplied <strong>IE</strong>-<strong>33</strong>M, or <strong>IE</strong>-<strong>35</strong>M microphone,<br />
is a Type II sound level meter, and therefore satisfies OSHA minimum requirements. The electronics of<br />
the <strong>IE</strong>-<strong>33</strong> and <strong>IE</strong>-<strong>35</strong> meet Type I specifications, however. With the addition of an optional Type I microphone<br />
and preamplifier, both the <strong>IE</strong>-<strong>33</strong> and the <strong>IE</strong>-<strong>35</strong> become Type I measurement systems.<br />
In addition to the equipment meeting minimum specification standards, it must also be properly calibrated in<br />
order for an acceptable OSHA measurement to be made. What this normally requires is calibration prior to the<br />
measurement, and then a recheck of calibration after the measurement is made. In the case of SPL measurements,<br />
a calibration device (either a pistonphone or an acoustic calibrator) must be used. The standard <strong>IE</strong>-<strong>33</strong>M<br />
and <strong>IE</strong>-<strong>35</strong>M microphones are 8mm diameter, electret condenser microphones. Either can be calibrated with<br />
any quality calibration device that will accept a 8mm adapter. Most calibrators have a larger diameter opening<br />
to accommodate microphones up to one inch or slightly larger in diameter, and have plug-in adapters to reduce<br />
the opening size for smaller microphones. The <strong>Ivie</strong> Type I microphones, along with many other international<br />
standard air condenser microphones, are 1/2 inch in diameter and require the use of a 1/2 inch adapter when<br />
calibrating. With either <strong>Ivie</strong> microphone, the same calibration process applies. It is important that the microphone<br />
fit snugly inside the adapter to assure accurate readings during calibration.<br />
For complete information on calibration, see Appendix II of this manual dealing with this subject.<br />
Sound Pressure Level (SPL) Monitor<br />
The <strong>IE</strong>-<strong>33</strong> and <strong>IE</strong>-<strong>35</strong> normally display SPL readings in the lower-right corner of the display screen, as shown in<br />
the illustration across the page. Immediately below the level readout, the weighting is displayed (A, C or Flat).<br />
The detector selected is displayed on the blue colored stylus button in the center column of stylus buttons (Fast,<br />
Slow, Peak or Impulse).<br />
There are occasions when a much larger SPL display may be desirable. The "SPL Monitor" function provides<br />
this. To access SPL Monitor, tap the "Function" pop-up menu and then tap "SPL Monitor" to activate this function.<br />
The large SPL display shown across the page will appear. The SPL at a resolution of 1dB will be displayed<br />
in very large, easy to see numbers. The smaller SPL readout in the lower-right of the screen will also<br />
continue to function, providing its .1 dB resolution readout.<br />
There is also a convenient bar graph display shown along with the large numerals. You can program this bar<br />
graph to change colors at specific sound pressure levels. To do this, while in the SPL Monitor mode, tap the<br />
"Options" pop-up menu and select Set dB Levels. The level for color change can then be set as shown in the<br />
illustration across the page. The bar graph will change from green to yellow at the lower level programmed, and<br />
from yellow to red at the upper level programmed. This feature can be extremely useful in some applications.
<strong>Ivie</strong> <strong>IE</strong>-<strong>33</strong> & <strong>IE</strong>-<strong>35</strong> <strong>Manual</strong><br />
The large SPL display combined with a bar graph that changes colors at<br />
user defineable set points facilitates SPL Monitoring of "live sound" events.<br />
Set the controls to "Slow" and "A-Weighted."<br />
TIP! - The iPAQ charging cradle can hold the <strong>IE</strong>-<strong>33</strong>, jacket and all. When<br />
placed on a mixing console or desk top, the cradle holds the <strong>IE</strong>-<strong>33</strong> at a<br />
convenient viewing angle and can power the <strong>IE</strong>-<strong>33</strong> and charge its batteries<br />
at the same time.<br />
Options<br />
Options<br />
Sound Pressure Level (SPL) Monitor<br />
Options<br />
Entering the Set points<br />
1 -Tap "Options" and then "Set dB<br />
Levels."<br />
2- Set dB Lower set point.<br />
3- Set dB Upper set point.<br />
4- Tap the "ok."<br />
Tap to select different Weighting Filters to<br />
be applied to the SPL Meter.<br />
Tap to select different detector response<br />
times for the SPL Meter.<br />
page 29
Sound Pressure Level: Seat-to-Seat<br />
page 30<br />
<strong>Ivie</strong> <strong>IE</strong>-<strong>33</strong> & <strong>IE</strong>-<strong>35</strong> <strong>Manual</strong><br />
The large numeral SPL reading reflects the results of the detector selected (Fast, Slow, Peak or Impulse), and<br />
the weighting selected (A weighted, C weighted or Flat). In addition, the SPL Monitor function provides level<br />
monitoring in octave band levels. Technically, octave band readings are level measurements and not SPL<br />
measurements, since SPL is, by definition, a broad band measurement.<br />
Monitoring of octave band levels is possible in the following octaves: 125 Hz, 250 Hz, 500 Hz, 1 kHz, 2 kHz and<br />
4 kHz. To select one of these octave centers, tap the green "Weighting" stylus button. It will toggle with successive<br />
taps from Flat to A weighted, to C weighted, to 125 Hz, 250 Hz , 500 Hz, 1 kHz, 2 kHz and 4 kHz, and back<br />
again to Flat.<br />
Sound Pressure Level (SPL) Seat-to-Seat<br />
One of the highly useful functions of the <strong>IE</strong>-<strong>33</strong> and <strong>IE</strong>-<strong>35</strong> is the measurement of Seat-to-Seat variation. This<br />
function can be used to measure the uniformity of sound level throughout a venue. The Seat-to-Seat function<br />
allows you to set a reference level, which then becomes equated to 0 dB. As you move throughout the venue,<br />
level in dB above or below the reference level is clearly indicated. As shown in the illustration across the page,<br />
Seat-to-Seat variation is displayed in large numerals.<br />
Additionally, there is a bar graph that displays Seat-to-Seat variation up to plus or minus 12 dB. There is also a<br />
numeric readout which displays maximum deviation, the same data as the bar graph, except that it is not limited<br />
to a range of plus or minus 12 dB. Of course, absolute SPL is also shown immediately above the maximum<br />
deviation readout.<br />
The large numeral SPL reading, as well as the bar graph and the maximum deviation readout, reflect the results<br />
of the detector selected (Fast, Slow, Peak or Impulse), and the weighting selected (A weighted, C weighted or<br />
Flat). In addition, just as in the SPL Monitor function, the Seat-to-Seat variation function provides level monitoring<br />
in octave band levels.<br />
Monitoring of octave band levels is possible in the following octaves, as shown in the display across the page:<br />
125 Hz, 250 Hz, 500 Hz, 1 kHz, 2 kHz and 4 kHz. To select one of these octave centers, tap the green<br />
"Weighting" stylus button. It will toggle with successive taps from Flat to A weighted, to C weighted, to 125 Hz,<br />
to 250 Hz, to 500 Hz, to 1 kHz, to 2 kHz, to 4 kHz and back again to Flat.<br />
Making a Seat-to-Seat Measurement<br />
To make a Seat-to-Seat deviation measurement, tap the "Function" pop-up menu and select "Seat-to-Seat."<br />
Next, with steady-state noise playing in the venue, select a representative spot as the reference. Once a representative<br />
spot is located, establish it as the reference by carefully tapping the "Reset" stylus button. (This<br />
"Reset" reference level will be remembered by the software even if Seat-to-Seat screen is left, but will not be<br />
retained once the analyzer software program has been exited). Hint: Tapping the "Reset" stylus button roughly<br />
will cause microphonic noise to travel through the unit (like tapping a microphone with your finger) which will elevate<br />
the noise level seen by the <strong>IE</strong>-<strong>33</strong>, or <strong>IE</strong>-<strong>35</strong>, thus setting a "false" reference level. Once the reference level<br />
has been set, walking the venue will clearly indicate the level variation at various locations within the venue.<br />
The type of venue will help determine the settings for the <strong>IE</strong>-<strong>33</strong>, or <strong>IE</strong>-<strong>35</strong>, when measuring Seat-to-Seat variation.<br />
The majority of venues will likely be measured in Slow response, as opposed to Fast or Peak. The bandwidth<br />
and weighting applied are more likely to change from venue to venue. If the system is intended for music<br />
reinforcement, you may want to measure Seat-to-Seat in the Flat mode to assure full-range uniformity from<br />
Seat-to-Seat. You may also wish to measure the same venue A weighted if there are concerns about it meeting<br />
local noise or sound level ordinances, which will likely be written around A weighted measurements.<br />
On the other hand, venues intended primarily for voice reinforcement may likely be "rolled off" on the high end<br />
as well as the low end. It is not unusual to encounter Seat-to-Seat measurement specifications written around<br />
band limited noise center at 4 kHz. Both the <strong>IE</strong>-<strong>33</strong> and the <strong>IE</strong>-<strong>35</strong> meet this requirement nicely.
<strong>Ivie</strong> <strong>IE</strong>-<strong>33</strong> & <strong>IE</strong>-<strong>35</strong> <strong>Manual</strong><br />
Step 1 -<br />
Step 2 -<br />
Step 3 -<br />
Step 4 -<br />
Step 5 -<br />
Options<br />
Set the <strong>IE</strong>-<strong>33</strong> for "Slow" response and "2 kHz" filter weighting.<br />
Energize the sound system with pink noise with the SPL in the room at least 10 dB<br />
above the ambient noise.<br />
Go to the first measurement position and press the "Reset" button to zero the meter to<br />
that position.<br />
Walk from seat to seat over the first coverage area and then note the Maximum and<br />
Minimum SPLs measured. This measures the Seat-to-Seat variation for that area.<br />
Go to the next area, press "Reset" and make a new measurement.<br />
Graphic representaion of Min/Max and Current SPL deviation from zero. The<br />
green box represents the Min/Max and the blue bars the Current deviation. This is<br />
reset whenever the "Reset" button is pressed.<br />
Options<br />
Sound Pressure Level: Seat-to-Seat<br />
Real time, absolute value of SPL.<br />
Maximum SPL (+) deviation from zero,<br />
relative to the last time the "Reset" button<br />
was pressed.<br />
Minimum SPL (-) deviation from zero,<br />
relative to the last time the "Reset" button<br />
was pressed.<br />
Current +/- SPL deviation from zero,<br />
relative to the last time the "Reset" button<br />
was pressed.<br />
Pressing the "Reset" button clears all<br />
Min/Max and Current data and sets them<br />
to Zero at the moment of the button press.<br />
From that moment forward, the Minimum,<br />
Maximum and Current displays show the<br />
+/- SPL relative to when the meter was<br />
"Zeroed Out" (Reset button pressed).<br />
Tap to select different Weighting Filters to<br />
be applied to the SPL Meter.<br />
Tap to select different detector response<br />
times for the SPL Meter.<br />
page 31
Strip Chart Recorder<br />
Strip Chart<br />
page 32<br />
<strong>Ivie</strong> <strong>IE</strong>-<strong>33</strong> & <strong>IE</strong>-<strong>35</strong> <strong>Manual</strong><br />
The Strip Chart feature of the <strong>IE</strong>-<strong>33</strong> and <strong>IE</strong>-<strong>35</strong> harks back to the days of pen on strip chart paper. We still find<br />
this type of visual presentation to be one of the clearest and easiest to “digest” when looking at amplitude over<br />
time. With Strip Chart, it is possible to record and review variations in amplitude over times ranging from one<br />
minute to eight hours. Data collected in Strip Chart measurements can be viewed on-screen and/or on the PC,<br />
or can be stored for later analysis.<br />
To begin making a Strip Chart measurement, first select the desired weighting or filtering for the recording. Flat,<br />
A, or C weighting may be selected. Additionally the measurement can be band limited to one of several octave<br />
filters (125 Hz, 250 Hz, 500 Hz, 1 kHz, 2 kHz, or 4 kHz). This can be useful in crafting a measurement that will<br />
be meaningful for the purpose intended.<br />
Next, select the broadband SPL response detector. The standard Type I SPL detectors (Fast, Slow, Peak and<br />
Impulse) can be selected. Impulse would rarely be used. Fast and Peak provide very useful data for analysis,<br />
and Slow would be used for most environmental noise measurements, as many OSHA and other regulatory<br />
measurements specify A weighted, Slow measurements.<br />
The final set-up requirement for making a Strip Chart measurement is to select the length of the recording<br />
desired. This is chosen by making a selection in “Chart Time” (Options> Chart Time). Additionally, you can set<br />
visual minimum and maximum indicators with the Set dB Levels (Options > Set dB Levels) boxes. This gives a<br />
visual indication when levels go above or below the levels you have set, and can be very useful locating "problem<br />
levels" at a glance. If you select a recording time longer than five minutes, it will be important to consult<br />
Tip #2 below.<br />
In the "Options” pop up menu, you can also select the vertical display dB/division (this can also be done with the<br />
left-most two mechanical buttons on the iPAQ or the Axim). The dB/Div and recording time are shown in the<br />
upper left of the main display window.<br />
Once all the selections are made, you can “drop the pen” onto the “paper” by tapping “Start.” It is possible to<br />
stop the recording at any time by tapping “Stop.” At the end of the designated recording time it will automatically<br />
stop and present a screen to name and store the recorded measurement.<br />
Reviewing a recorded Strip Chart measurement is intuitive. Follow the directions on the opposing page.<br />
Additionally, the following tips can be very helpful:<br />
Tip #1:<br />
In addition to using the software “slider” to page through the displayed data, you can also use the left-most two<br />
iPAQ, or Axim buttons to page. Using the iPAQ, or Axim left/right rocker “joystick” you can walk the cursor to the<br />
left or right on the chart. When you reach the edge of the screen, the cursor will “bump” to the next page and<br />
reposition itself to the next pixel (it will appear to jump from one side of the screen to the other) on the chart.<br />
Tip #2:<br />
When recording a Strip Chart with a chart time of anything over 5 minutes, you may encounter the iPAQ, or<br />
Axim power management limits. Setting the power management of an iPAQ, or Axim (under battery operation)<br />
to maximum (Today Screen > Start > Settings > System > Power) you can operate the unit on battery for a<br />
maximum of only about 5 minutes, without touching some kind of control, before it will turn off. Also, under<br />
System > Settings > Back light, the maximum setting while battery powered is also five minutes. When making<br />
a Strip Chart recording longer than 5 minutes you will want to arrange to power the unit from the charger.<br />
Settings under power management while the unit is under charger power allow an iPAQ, or Axim, to<br />
keep running with the screen lit indefinitely.
<strong>Ivie</strong> <strong>IE</strong>-<strong>33</strong> & <strong>IE</strong>-<strong>35</strong> <strong>Manual</strong><br />
Step 1 - Select SPL<br />
Weighting.<br />
Step 2 - Select SPL<br />
detector response.<br />
Step 3 - Select Recording<br />
time by tapping Options,<br />
Chart Speed, and then the<br />
recording time.<br />
Step 4 - Press the<br />
"Start/Stop" button.<br />
Completed 5 minute<br />
Recording. Upon<br />
completion, a Save to<br />
File screen is<br />
automatically<br />
displayed.<br />
Options<br />
Options<br />
Options<br />
dB per Division and Recording time<br />
Recording Pen - Green in color when<br />
the pen is down and writing/recording.<br />
Red in color when pen is lifted and not<br />
writing. Note: the pen is always<br />
responding to the SPL even when not<br />
writing.<br />
Darkened areas are visual Min/Max<br />
indicators set in the"Options/Set dB<br />
Levels" menu.<br />
Current SPL and Weighting.<br />
Clears the current Recording<br />
Options<br />
and resets time to zero.<br />
Save Chart - stops the current Recording and saves<br />
data to a File. Brings up a "File Save" screen.<br />
Viewing a Previously Recorded File<br />
To view a Saved Chart<br />
press the "Load Chart"<br />
button to display the<br />
above screen, then<br />
select the desired<br />
Chart.<br />
Press to unload file<br />
and return to<br />
recording screen.<br />
Minimum<br />
data point.<br />
The Chart is displayed in an<br />
expanded form so that each data<br />
point is represented by one pixel.<br />
The slide is used to "Page" through<br />
the data one screen at a time.<br />
Strip Chart Recorder<br />
Cursor controlled<br />
by the Joystick or<br />
by tapping on the<br />
screen with the<br />
stylus.<br />
Options<br />
Maximum<br />
data point.<br />
Data at<br />
Cursor.<br />
Scroll through data including:<br />
File name, Test date/time, Total<br />
number of data points, Sample<br />
interval, Weighting, Max SPL &<br />
time, Min SPL & time.<br />
page <strong>33</strong>
Polarity<br />
Polarity<br />
page 34<br />
<strong>Ivie</strong> <strong>IE</strong>-<strong>33</strong> & <strong>IE</strong>-<strong>35</strong> <strong>Manual</strong><br />
The Polarity feature of the <strong>IE</strong>-<strong>33</strong> and <strong>IE</strong>-<strong>35</strong> allow the user to test for the polarity of a loudspeaker with respect to<br />
the signal source, or with respect to other loudspeakers.<br />
Normally, in a correctly wired system, positive voltage on the “+” output of the signal source (amplifier) should<br />
generate outward speaker cone travel (away from the speaker housing and magnet). More important to the perception<br />
of the listener is the uniform polarity wiring of all speakers in a system.<br />
The <strong>IE</strong>-<strong>33</strong>, or <strong>IE</strong>-<strong>35</strong>, can help the user to quickly test for correct polarity. In order to test for polarity a pulse must<br />
be generated and sent through the speakers to be tested. Both the <strong>IE</strong>-<strong>33</strong> and <strong>IE</strong>-<strong>35</strong> can generate the special<br />
pulse needed to do the polarity test, though it may be desirable to generate the pulse external to these units<br />
(see Tip #2 below). To generate the pulse from the <strong>IE</strong>-<strong>33</strong>, or the <strong>IE</strong>-<strong>35</strong>, connect the output (iPAQ, or Axim earphone<br />
output = 3.5 mm phone jack) to an input in signal processing chain going to the speaker system. From<br />
the Polarity screen (Function > Polarity), tap the “Pulse On” button in the lower right of the screen. A special<br />
pulse will begin to repeat.<br />
In order to make a valid test, the <strong>IE</strong>-<strong>33</strong>, or <strong>IE</strong>-<strong>35</strong> microphone should be in the direct field of the loudspeaker. As<br />
you move the microphone close enough to a loudspeaker to be in the direct field, the Polarity display will show<br />
“+” Positive Polarity, or “-” Negative Polarity, or “- - - “ No Lock. “Positive Polarity” means that the system is<br />
wired so that the loudspeaker is correctly reproducing the output of the amplifier with regard to polarity.<br />
“Negative Polarity” means the opposite. “No Lock” means that the microphone is either “confused” because it is<br />
not in the direct field and is seeing too high a level of reverberant energy relative to the direct field, or the overall<br />
level of the speakers is not sufficiently above the room’s noise floor. These conditions can be corrected by<br />
either moving the microphone closer to the speaker or raising the output level of the loudspeaker.<br />
The most important function of the Polarity test is to assure that multiple loudspeakers in a distributed speaker<br />
system are wired so as to be of uniform polarity. By starting the pulse signal and then moving from the direct<br />
field of one speaker to the next, the user can quickly confirm that the speakers are correctly wired for uniform<br />
polarity. The following tips may also prove useful:<br />
Tip #1<br />
When speakers are mounted in a ceiling more than eight feet above the floor, it may not be possible to move the<br />
microphone into the direct field of the speakers when the microphone is mounted to the <strong>IE</strong>-<strong>33</strong>, or <strong>IE</strong>-<strong>35</strong> (unless<br />
the user is on stilts!!). Using a microphone extension cable and a means of elevating the microphone closer to<br />
the speakers can provide the solution (a broomstick and some tape works very well!).<br />
Tip #2<br />
Often, using the pulse generated by the <strong>IE</strong>-<strong>33</strong>, or <strong>IE</strong>-<strong>35</strong>, can be impractical since a long microphone extension<br />
cable, or a long output cable, or both, might be called for in order to get the pulse signal into the sound system<br />
while simultaneously moving the microphone close to the speakers. In most cases it is easier to use a separate<br />
pulse source instead of the <strong>IE</strong>-<strong>33</strong>, or <strong>IE</strong>-<strong>35</strong>. There are several ways this can be done.<br />
One way to do this would be to record the pulse and play it back to the sound system with a player. Another<br />
would be to use the .wav file of the pulse provided on the CD that comes with both the <strong>IE</strong>-<strong>33</strong> and the <strong>IE</strong>-<strong>35</strong>.<br />
Yet another way would be to use an external generator that creates a pulse that is compatible with the Polarity<br />
feature of the <strong>IE</strong>-<strong>33</strong> and <strong>IE</strong>-<strong>35</strong>. The Neutrik® “Minirator”, for example, generates such a pulse.
<strong>Ivie</strong> <strong>IE</strong>-<strong>33</strong> & <strong>IE</strong>-<strong>35</strong> <strong>Manual</strong><br />
Making a Polarity Measurement<br />
Step 1 - Connect the Polarity Pulse Generator output of the <strong>IE</strong>-<strong>33</strong><br />
(iPAQ headphone 3.5 mm stereo jack) to the line-level input of the<br />
sound system. Note: The Neutrik Minirator MR1 generator provides<br />
a compatible polarity generator signal.<br />
Step 2 - Tap the "Pulse On" control to turn on the pulse generator<br />
and set the output level of the speaker so that it is at least 10 dB<br />
above the ambient noise.<br />
Step 3 - Position the <strong>IE</strong>-<strong>33</strong> microphone so that it is in close proximity<br />
to the speaker under test. If you are too far away from the<br />
loudspeaker the <strong>IE</strong>-<strong>33</strong> may not be able to achieve a "lock" on the<br />
polarity.<br />
Step 4 - Read the polarity of the loudspeaker.<br />
The <strong>IE</strong>-<strong>33</strong> is unable to achieve<br />
a "lock" on the signal. Make<br />
sure the output level of the<br />
speaker is at least 10 dB over<br />
ambient. Move the microphone<br />
closer to the speaker.<br />
Options<br />
Options<br />
Options<br />
The <strong>IE</strong>-<strong>33</strong> has identifed the<br />
polarity of the speaker as<br />
"Positive."<br />
Options<br />
The <strong>IE</strong>-<strong>33</strong> has identifed the<br />
polarity of the speaker as<br />
"Negative."<br />
Polarity<br />
page <strong>35</strong>
Preference Menu, Scope & Sig. Gen.<br />
Preferences Menu<br />
page 36<br />
<strong>Ivie</strong> <strong>IE</strong>-<strong>33</strong> & <strong>IE</strong>-<strong>35</strong> <strong>Manual</strong><br />
The preferences menu (File>Preferences) provides access to a number of special selections and functions.<br />
These are detailed below:<br />
Diagnostics<br />
Choosing Diagnostics provides a temporary setting (resets when the application is closed) that changes the<br />
green/red box under the SPL window in the Main Display to show a numerical indication of the measurement<br />
cycle time. The number represents the time required, in milliseconds, to complete a measurement cycle. The<br />
Diagnostics setting is not normally displayed, but can help Technical Support Engineers to better support you if<br />
you call the support center.<br />
Power Average / Arithmetic Average<br />
The <strong>IE</strong>-<strong>33</strong> and the <strong>IE</strong>-<strong>35</strong> will perform two types of averaging, depending on the type of measurement and preference<br />
of the user. The default setting is "Arithmetic". Power Averaging is most useful when doing transmission<br />
loss and other such measurements where an average of power rather than level is required. The equations for<br />
each are shown on page <strong>33</strong> across the page.<br />
Oscilloscope (Scope)<br />
The Oscilloscope Function provides a single or dual channel (dual trace, or XY) audio frequency (20 Hz to<br />
20 kHz) oscilloscope. Page <strong>33</strong>, across, contains illustrations regarding control details. The oscilloscope is useful<br />
in viewing wave forms of various signals. To use the oscilloscope function, the "Channel 1 (Line Level)" input<br />
must be selected if a single channel oscilloscope measurement is desired. If a dual channel measurement is<br />
required, the "Channel 1 & 2 Scope: XY/Dual Trace" inputs need to be selected. Input selection is done in the<br />
following manner:<br />
Input Select<br />
The Input Select menu is located under the "File" pop-up menu. There are several inputs on the <strong>IE</strong>-<strong>33</strong> and<br />
<strong>IE</strong>-<strong>35</strong> (a microphone connector and two RCA connectors). This selection area allows the user to select the<br />
desired input or inputs. Remember that the <strong>IE</strong>-<strong>33</strong> and <strong>IE</strong>-<strong>35</strong> are two channel devices The microphone input<br />
and Channel 1 line input are in parallel - both feed Channel 1.<br />
The Channel 2 input is line level only.<br />
Dual Trace or XY Measurements<br />
When making dual channel measurements in the oscilloscope mode, either dual trace or XY measurements can<br />
be selected using the "Options" pop-up menu.<br />
Signal Generator<br />
The <strong>IE</strong>-<strong>33</strong> and <strong>IE</strong>-<strong>35</strong> provide a simple signal generator. The output of the generator is available at the iPAQ, or<br />
Axim, headphone jack, and the level of this signal is controlled by the audio level output control of the PDA (see<br />
the iPAQ or Axim user instruction manual). Sine, Square, and Triangle wave forms can be selected, as can Pink<br />
Noise and White Noise. The Main Display in this function shows the waveform of the selected signal type. See<br />
page <strong>33</strong> across for software controls for the Signal Generator. In addition to the software slider, frequency can<br />
also be selected with the iPAQ or Axim "joystick" left/right controls. Do NOT plug the output of the iPAQ, or<br />
Axim into a mic input that has phantom power active. The phantom power will blow your PDA output.
<strong>Ivie</strong> <strong>IE</strong>-<strong>33</strong> & <strong>IE</strong>-<strong>35</strong> <strong>Manual</strong><br />
Preferences Menus<br />
Displays an indicator, in milliseconds, of the time<br />
required for a complete measurement cycle.<br />
Choose one of two different Averaging algorithms<br />
for the Averaging function.<br />
Oscilloscope<br />
Use the "File/Input Select" menu to select Line Level Inputs(s).<br />
To use the Single Trace scope select either Channel 1 or 2 ,Line<br />
Level input and connnect the Scope to that RCA input.<br />
To use either the Dual Trace or XY function select the "Channel 1& 2"<br />
Scope XY/Dual Trace Input. Use both RCA input connectors.<br />
Tapping this control increases<br />
the "sweep speed" causing the<br />
waveform to expand on the<br />
screen.<br />
Tapping this control decreases<br />
the "sweep speed" causing the<br />
waveform to contract on the<br />
screen.<br />
Decreases the input sensitivity<br />
(vertical) causing the waveform<br />
to dcrease vertically in<br />
amplitude.<br />
Increases the input sensitivity<br />
(vertical) causing the waveform<br />
to increase vertically in<br />
amplitude.<br />
Signal Generator<br />
Power Average =10 log 10<br />
Arithmetic Average =<br />
SPL i<br />
The output of the signal generator is the Headphone jack of the iPAQ.<br />
The output level is controlled via iPAQ volume control.<br />
Waveform display of selected signal source.<br />
Display of frequency selected by the slider control.<br />
The slider controls the output frequency of the Generator.<br />
Tap to select the type of signal to be generated.<br />
Options Options<br />
Single Trace<br />
1<br />
N<br />
N<br />
i=1<br />
These controls allow<br />
the vetical positioning<br />
of the trace on the<br />
screen.<br />
Preference Menu, Scope & Sig. Gen.<br />
N<br />
10<br />
i=1<br />
N<br />
SPL<br />
10 i<br />
XY Display<br />
With Ch 1&2 Input<br />
selected the Options<br />
menus allows<br />
selection of Dual Trace<br />
or XY.<br />
Waveform display controls,<br />
same as oscilloscope.<br />
Dual Trace<br />
Tapping this control to<br />
switch other applicable<br />
controls between Ch1<br />
or Ch2.<br />
Options<br />
page 37
Volt Meter<br />
Volt Meter<br />
page 38<br />
<strong>Ivie</strong> <strong>IE</strong>-<strong>33</strong> & <strong>IE</strong>-<strong>35</strong> <strong>Manual</strong><br />
One of the most useful functions of the <strong>IE</strong>-<strong>33</strong> and <strong>IE</strong>-<strong>35</strong> is its ability to measure electrical signals as well as<br />
acoustic signals. This can be extremely effective for trouble-shooting and system setup. As an example, pink<br />
noise could be fed into the first component of a sound reinforcement signal chain. Using an <strong>IE</strong>-<strong>33</strong>, or <strong>IE</strong>-<strong>35</strong> a<br />
technician, or consultant could step through each of the sound system components. Levels at inputs and outputs<br />
could be measured, along with the frequency response at every stage. Crossover points and slopes could<br />
be viewed, equalizer effects noted, level changes assessed and proper signal flow verified. A wealth of information<br />
would be available by simply probing the electrical inputs and outputs along the signal chain.<br />
The <strong>IE</strong>-<strong>33</strong> and <strong>IE</strong>-<strong>35</strong> are capable of directly measuring preamp level voltages (not to exceed 7.5 volts).<br />
Feeding voltages higher than 7.5 volts (+19 dBu) directly into an <strong>IE</strong>-<strong>33</strong>, or <strong>IE</strong>-<strong>35</strong> could cause damage and<br />
void the warranty. Higher voltages may be measured only with the addition of an external pad.<br />
Volts RMS<br />
When this mode is selected (see the illustration across the page for visual instructions on selecting various<br />
measurement options), the <strong>IE</strong>-<strong>33</strong>, or <strong>IE</strong>-<strong>35</strong>, functions as a true RMS volt meter. Measured voltages are shown<br />
simultaneously by a digital and an analog display.<br />
Volts Peak to Peak (Volts PP)<br />
In this mode, the <strong>IE</strong>-<strong>33</strong> and <strong>IE</strong>-<strong>35</strong> function as a peak voltage meters. Measured voltages are shown simultaneously<br />
by a digital and an analog display.<br />
dB Volts (dBV)<br />
When this mode is selected, the <strong>IE</strong>-<strong>33</strong> and <strong>IE</strong>-<strong>35</strong> function as a volt meters measuring in dB relative to 1 volt<br />
RMS. Measured voltages are shown simultaneously by a digital and an analog display.<br />
dB Volts Unterminated (dBu)<br />
In this mode, the <strong>IE</strong>-<strong>33</strong> and <strong>IE</strong>-<strong>35</strong> function as volt meters measuring in dB relative to .775 volts RMS.<br />
Measured voltages are shown simultaneously by a digital and an analog display.<br />
Nixie Tube Readout<br />
Using the "Options” menu, a more nostalgic Nixie tube digital display can be selected (see the illustration across<br />
the page). Choosing the Nixie tube readout effects the digital display only. The analog display continues to<br />
function without change.<br />
Measuring Voltages and Viewing Spectral Information Simultaneously<br />
When "Volt Meter" has been selected using the Function Pop-up Menu, only the voltage measuring displays<br />
shown across the page are available. If measuring voltages and viewing spectral information at the same time<br />
is desired, this is also possible.<br />
To view spectral content and measure voltages simultaneously, keep the <strong>IE</strong>-<strong>33</strong>, or <strong>IE</strong>-<strong>35</strong>, in the spectrum analysis<br />
mode. Next, use the dB SPL readout box as a stylus button. Successively tapping this button will toggle the<br />
<strong>IE</strong>-<strong>33</strong>, or <strong>IE</strong>-<strong>35</strong>, from dB (A, C, or F, depending on what has been selected) to Volts RMS, to Volts Peak to Peak,<br />
to dB Volts, to dBu and back to dB SPL. The dB SPL readout now becomes the Volt Meter readout.<br />
Of course, for this type of measurement, a line input for the <strong>IE</strong>-<strong>33</strong>, or <strong>IE</strong>-<strong>35</strong>, should be selected.
<strong>Ivie</strong> <strong>IE</strong>-<strong>33</strong> & <strong>IE</strong>-<strong>35</strong> <strong>Manual</strong><br />
CAUTION-Do NOT exceed input voltage of 7.5 Volts RMS AC (19 dBu)<br />
Step 1- Under the "Function"<br />
menu select "Volt Meter"<br />
Step 2- Under the "File" menu select<br />
"Input Select", then "Channel 1<br />
(Line Level), then press "OK."<br />
Step 4- Tap here to select desired display: Vrms, V peak to peak, dBV, or dBu.<br />
A more nostalgic Nixie tube<br />
readout may be selected via<br />
the "Options" menu.<br />
Options<br />
Options<br />
Options<br />
Options<br />
Options<br />
Options<br />
Voltage or dB value<br />
+++ = signal is overange<br />
--- = signal is underange<br />
Ch.1<br />
Step 3- Connect to Ch.1<br />
Line Input RCA connector<br />
Options Options<br />
V~ = AC volts RMS<br />
V PP = AC Volts Peak-to-Peak<br />
dBV = dB relative to 1 volt<br />
dBu = dB relative to .775 volt<br />
(F) = No weighting applied<br />
(A) = "A" weighting applied to measurement<br />
(C) = "C" weighting applied to measurement<br />
Indicates Ch.1/Line 1 input is selected<br />
Volt Meter<br />
page 39
Appendix I: Trouble-Shooting<br />
Simple Trouble-Shooting<br />
page 40<br />
<strong>Ivie</strong> <strong>IE</strong>-<strong>33</strong> & <strong>IE</strong>-<strong>35</strong> <strong>Manual</strong><br />
One of the great advantages of the <strong>IE</strong>-<strong>33</strong> and <strong>IE</strong>-<strong>35</strong>, is that they function as a software program on an iPAQ, or<br />
Axim. When not running the <strong>IE</strong>-<strong>33</strong>, or <strong>IE</strong>-<strong>35</strong> software, you have the bonus of having a standard PDA, with all its<br />
inherent capabilities, software, data, time management and business management tools. The HP® iPAQ 3950,<br />
3955, 5550, 5555 and the Dell® Axim X51v are all 64MB PDA’s. The <strong>IE</strong>-<strong>33</strong> and <strong>IE</strong>-<strong>35</strong> programs use under 300<br />
kilobits of this memory capacity. That leaves a lot of capability for other programs, data etc.<br />
The down side is, unless you’re careful, the other "stuff" you have in your PDA can affect the performance of the<br />
analyzer software. Following are some tips that may help prevent down-graded <strong>IE</strong>-<strong>33</strong>, or <strong>IE</strong>-<strong>35</strong> performance.<br />
The <strong>IE</strong>-<strong>33</strong>, or <strong>IE</strong>-<strong>35</strong> Display Appears to be Running in "Slow Motion"<br />
Other applications running in the background can and will degrade the performance of the <strong>IE</strong>-<strong>33</strong>, or <strong>IE</strong>-<strong>35</strong>. If<br />
your unit seems lethargic, it may be because it is having to share processing time with other applications. You<br />
may have opened an application and not closed it (even the calendar or task list can slow things down a bit).<br />
Closing applications in the Pocket PC environment is sometimes not intuitive. To check on this, close the analyzer<br />
software and go to the main "Today" screen of the iPAQ, or Axim. Tap "Start" in the upper left corner of the<br />
screen. Now tap Settings > System > Memory > Running Programs. You will see a list of the applications that<br />
are running in the background in your PDA. Tap "Stop All" to close all applications. Alternatively, you can select<br />
individual applications and close them one at a time.<br />
When you're done, tap "OK" in the upper right corner of the screen, then tap the "X" in the upper right corner to<br />
return to the Today screen.<br />
The "sure fire" way to shut down all applications is to do a "soft reset" by poking your stylus in the little hole in<br />
the bottom of the iPAQ, or back of the Axim, designed for that purpose. Doing this will shut down all applications<br />
and give you a fresh start.<br />
Exiting or Shutting Down Other PDA Applications<br />
The convention for shutting down applications in Pocket PC is, well, not what you might expect. In Pocket PC,<br />
the convenient little "X" in the upper right corner of the screen does not actually shut down the application; tapping<br />
the X will just put the application to "sleep" and keep it running in the background. There is no indication<br />
on the iPAQ, or Axim standard display that there are applications "asleep" in the background.<br />
In order to shut down a standard application one must go to the "File" menu of the application and tap "Quit" or<br />
"Exit."<br />
<strong>Ivie</strong> has chosen not to follow the Pocket PC convention. When you are in the <strong>IE</strong>-<strong>33</strong>, or <strong>IE</strong>-<strong>35</strong> software, tapping<br />
on the X WILL shut down the application.<br />
My <strong>IE</strong>-<strong>33</strong> Data, Applications, Measurements - Gone! All Gone!<br />
There is a major warning at the beginning of this manual concerning data loss. We repeat this warning here, so<br />
its unhappy effects may be avoided. The iPAQ will continue to discharge when sitting on the shelf in the<br />
"Off" position. If the battery runs down, everything in volatile memory will be lost - data, software - everything!<br />
It is wise to keep the IPAQ charged, and prudent to store in the iPAQ's non-volatile memory anything that must<br />
not be subject to loss. You have the choice of whether to store something in volatile or non-volatile memory, but<br />
you may not have enough non-volatile memory available to store everything there you would like to store.<br />
The Axim (<strong>IE</strong>-<strong>35</strong>) features “Retentive Memory” and is not subject to this problem when the battery runs down.
<strong>Ivie</strong> <strong>IE</strong>-<strong>33</strong> & <strong>IE</strong>-<strong>35</strong> <strong>Manual</strong><br />
Notes on calibration:<br />
1. Whichever microphone(s) is employed, it is calibrated to the <strong>Ivie</strong> <strong>IE</strong>-<strong>33</strong> Jacket (<strong>IE</strong>-<strong>33</strong>J) and not to the<br />
iPAQ Pocket PC. The iPAQ simply remembers and applies the calibration value of the Microphone/<strong>IE</strong>-<br />
<strong>33</strong>J combination to the calculations of <strong>IE</strong>-<strong>33</strong> SPL measurements. Calibration requires that the<br />
Microphone, Jacket, and iPAQ be kept together as a complete instrument. You will need to recalibrate<br />
the instrument if any of the above items are changed.<br />
2. The <strong>IE</strong>-<strong>33</strong>J and its accompanying <strong>IE</strong>-<strong>33</strong>M microphone have been calibrated to each other at the<br />
factory. A factory Certificate of Calibration is included with each <strong>IE</strong>-<strong>33</strong>J/Microphone combination. If you<br />
purchased a complete <strong>IE</strong>-<strong>33</strong> including an iPAQ, the calibration number has been entered into your iPAQ<br />
and you DO NOT NEED to complete the initial calibration procedure below. If you have supplied your<br />
own iPAQ, YOU MUST follow the Initial Calibration Procedure below.<br />
3. Periodic Calibration may be performed in the field if you own an SPL Calibrator. The procedure for<br />
this is listed below.<br />
Step 1 - Remove the iPAQ from the<br />
<strong>IE</strong>-<strong>33</strong>J jacket. The iPAQ must not be<br />
connected to the <strong>IE</strong>-<strong>33</strong>J in any way.<br />
Step 2 - Press "File/Input Select"<br />
Menu.<br />
Step 3 - Make sure the Mic to be<br />
calibrated is selected.<br />
The iPAQ can remember the calibration<br />
values for up to six different microphones.<br />
Press the "Calibrate" button to enter the<br />
calibration screen.<br />
Step 4 - Using the Up/Down buttons,<br />
enter the calibration value from the<br />
supplied "Certificate of Calibration" into<br />
the "Calibrator dB SPL" window<br />
and press the "Calibrate" button.<br />
Step 5 - Press the "Done" button.<br />
Step 6 - Press the "OK" button to<br />
accept the calibration.<br />
Step 7 - Place the iPAQ into the <strong>IE</strong>-<strong>33</strong>J<br />
and you are now ready to use the<br />
Calibrated SPL functions of the <strong>IE</strong>-<strong>33</strong>.<br />
Appendix II: Mic Cal Procedure<br />
Calibration procedure for the <strong>IE</strong>-<strong>33</strong><br />
INITIAL CALIBRATION PERIODIC CALIBRATION<br />
(Without Calibrator) (With Calibrator)<br />
Step 1 - With the iPAQ inserted into the <strong>IE</strong>-<strong>33</strong>J,<br />
enter into the Calibration mode by selecting the<br />
"File/Input Select" Menu.<br />
Step 2 - Select which microphone you are<br />
going to calibrate to the <strong>IE</strong>-<strong>33</strong>J. The iPAQ<br />
can remember the calibration values for up<br />
to six different microphones.<br />
Step 3 - Place the Calibrator (user<br />
supplied) over the microphone to be<br />
calibrated. The <strong>IE</strong>-<strong>33</strong> SPL meter is<br />
automatically set to FAST response and<br />
FLAT weighting. The current dB SPL being<br />
measured by the <strong>IE</strong>-<strong>33</strong> will be displayed in<br />
real time in the ’Current dB SPL" window.<br />
Step 4 - Using the Up/Down buttons, enter<br />
the desired calibration level into the<br />
"Calibrator dB SPL" window. This would<br />
include any allowances for altitude and<br />
barometric pressure should your<br />
calibration equipment provide these.<br />
Step 5 - Press the "Calibrate" button.<br />
Step 6 - Press the "Done" button.<br />
Step 7 - Press the "OK" button to<br />
accept the calibration.<br />
Calibration Constant - For factory calibration, the CC value should match<br />
the CC value on your Factory Calibration Certificate. If you perform your<br />
own calibration the number may change, and should be recorded for future<br />
reference.<br />
page 41
Appendix III: Data & Program Xfer<br />
<strong>IE</strong>-<strong>33</strong>J Jacket & <strong>IE</strong>-<strong>35</strong> PAL: Data and Program Transfer<br />
page 42<br />
<strong>Ivie</strong> <strong>IE</strong>-<strong>33</strong> & <strong>IE</strong>-<strong>35</strong> <strong>Manual</strong><br />
If you have purchased the <strong>IE</strong>-<strong>33</strong>J, or <strong>IE</strong>-<strong>35</strong> PAL (jackets without PDA’s), you will need to install the <strong>IE</strong>-<strong>33</strong>, or <strong>IE</strong>-<strong>35</strong> software<br />
on your PDA in order to use the jacket and make measurements. Even if you have a complete <strong>IE</strong>-<strong>33</strong>, or <strong>IE</strong>-<strong>35</strong> package, you<br />
will need to install software upgrades and updates as they become available. Also, after measurement sessions you may<br />
wish to bring <strong>IE</strong>-<strong>33</strong>, or <strong>IE</strong>-<strong>35</strong>, data files across from the PDA to your PC for printing or further data manipulation.<br />
All data and program transfers between the <strong>IE</strong>-<strong>33</strong> iPAQ, or <strong>IE</strong>-<strong>35</strong> Axim and your PC are done using Microsoft's ActiveSync<br />
software. ActiveSync is provided on the standard CD that accompanies your PDA. Follow the instructions provided with<br />
your PDA to install the ActiveSync software and create a "partnership" between your PDA and your PC. Questions about the<br />
ActiveSync communication between your iPAQ, or your Axim, and your PC are supported by HP® or Dell®. Note: The<br />
iPAQ requires ActiveSync Version 3.7.1, or later, while the Axim requires ActiveSync Version 4.0, or later.<br />
Assuming that you have Microsoft ActiveSync installed and running on our PC, and that you can successfully synchronize<br />
your iPAQ, or your Axim, with your PC, let's talk about moving data and programs between these devices.<br />
Installing <strong>IE</strong>-<strong>33</strong>, or <strong>IE</strong>-<strong>35</strong>, Software or Software Updates<br />
Put your <strong>IE</strong>-<strong>33</strong> iPAQ, or your <strong>IE</strong>-<strong>35</strong> Axim, in the sync cradle (or attach the sync cable) and make sure synchronization communication<br />
is taking place. (As with many things in Windows, there is more than one way to skin a cat. We're just showing<br />
you one reliable way to do it here.)<br />
Open Windows Explorer and browse to the location of the <strong>Ivie</strong> "<strong>IE</strong>-<strong>33</strong>.exe" (or “<strong>IE</strong>-<strong>35</strong>.exe”) file. This may be on your hard<br />
drive if you downloaded an update, or on the CD that comes with the <strong>IE</strong>-<strong>33</strong>J or <strong>IE</strong>-<strong>35</strong> PAL. Now, right click on "<strong>IE</strong>-<strong>33</strong>.exe" (or<br />
“<strong>IE</strong>-<strong>35</strong>..exe”) and select "copy." Now browse to My Computer, Mobile Device, My Pocket PC, iPAQ File Store (for iPAQ), or<br />
Build-in Storage (for Axim). Right click on iPAQ File Store (for iPAQ), or Built-in Storage (for Axim) and select "copy."<br />
You have now successfully copied the file necessary to run the <strong>IE</strong>-<strong>35</strong> on you Axim, or have copied the <strong>IE</strong>-<strong>33</strong> software into<br />
the iPAQ File Store area of your iPAQ. The iPAQ File Store area in the 3900 and 5500 series iPAQ is a non-volatile storage<br />
area. Even if your batteries are completely drained, the <strong>IE</strong>-<strong>33</strong> program file will be safely stored in non-volatile memory.<br />
Now that the <strong>IE</strong>-<strong>33</strong> software is installed on your iPAQ, or the <strong>IE</strong>-<strong>35</strong> software on you Axim, remove the PDA from the<br />
ActiveSync cradle or cable and turn it on. Tap "Start" in the upper left corner of the screen. Tap "Programs." Select "File<br />
Explorer" by tapping on the icon. The "root" of the iPAQ file system is "My Device." Navigate to "iPAQ File Store." You<br />
should see the <strong>IE</strong>-<strong>33</strong> software"exe" file. Tap and hold the stylus on the <strong>IE</strong>-<strong>33</strong> file. Tapping and holding will bring up a menu.<br />
Tap on "Copy." You have now copied the <strong>IE</strong>-<strong>33</strong> software to the iPAQ's clipboard. These same instructions apply to the<br />
<strong>IE</strong>-<strong>35</strong>, except the <strong>IE</strong>-<strong>35</strong> software will be located in “Built-in Storage” on your Axim.<br />
Next, navigate back to "My Device," then tap on "Windows," then on "Start Menu." In the white screen area, tap and hold the<br />
stylus until a menu pops up. Now tap on "Paste Shortcut." You have copied a shortcut for the <strong>IE</strong>-<strong>33</strong>, or <strong>IE</strong>-<strong>35</strong>, program file<br />
into the Windows Start Menu. Each time you turn on your PDA and tap on the "Start" button in the upper left corner of the<br />
screen, you should see the choice for <strong>IE</strong>-<strong>33</strong>, or <strong>IE</strong>-<strong>35</strong>, on the main screen.<br />
Data Storage on the iPAQ<br />
The <strong>IE</strong>-<strong>33</strong> default directory for storing files is "My Documents." Virtually all of the Main Memory storage is available if you<br />
store to this directory. However, this memory area is volatile, so if the batteries totally discharge you will lose the stored data<br />
files. If you routinely charge the iPAQ this will never be a problem. However, if you have data files you wish to be secure in<br />
non-volatile memory, you can use the Memory Management screen (described elsewhere in this manual) to select "iPAQ File<br />
Store" as the target location for data storage. Any files stored in iPAQ File Store will be preserved in non-volatile memory.<br />
The <strong>IE</strong>-<strong>35</strong> files are stored under “My Documents” as well, but “Retentive Memory” prevents data loss from battery discharge.<br />
Transferring Data<br />
Data files stored on your PDA can be accessed by your PC under the “Mobile Device” directory. Using Windows Explorer,<br />
browse to My Computer, Mobile Device. There you will find the stored data files. Most data files have the extension ".ivi".<br />
Standard "Scratch" files have the default label "Scratch," followed by the number of the scratch file location. Preferred Curve<br />
files use the label "Preferred," and Peak files use the term "Peak." Strip Chart data files use the default label "Chart."<br />
However, the user can name these files to any name when saving them, or rename them at any time. The ".ivi" file extension<br />
must be maintained or an <strong>IE</strong>-<strong>33</strong>, or <strong>IE</strong>-<strong>35</strong>, will not be able to read the files.<br />
Select the data files you wish to transfer by holding down the ALT key and left clicking on the desired files, (the normal<br />
Windows conventions for selecting files apply). Once the files are selected, right click on any of the selected files and choose<br />
"copy." Now browse to the location on your computer's hard drive where you wish to locate the data files (usually in the<br />
"<strong>Ivie</strong>XLS" directory), right click on the chosen directory, and choose "paste." The selected files will be transferred to your PC.
<strong>Ivie</strong> <strong>IE</strong>-<strong>33</strong> & <strong>IE</strong>-<strong>35</strong> <strong>Manual</strong><br />
Connect to<br />
<strong>Ivie</strong> <strong>IE</strong>-<strong>33</strong>J<br />
Connect to<br />
<strong>Ivie</strong> <strong>IE</strong>-<strong>33</strong>J<br />
Connect to<br />
<strong>Ivie</strong> <strong>IE</strong>-<strong>33</strong>J<br />
Switchcraft<br />
TA4F<br />
Switchcraft<br />
TA4F<br />
Shield<br />
Shield<br />
Switchcraft<br />
TA4M<br />
1<br />
1<br />
2<br />
Audio (+)<br />
2<br />
3<br />
Audio (-)<br />
3<br />
4<br />
+Vdc<br />
4<br />
Schematic for <strong>Ivie</strong> Part# <strong>33</strong>MC-25 Extension Cable<br />
Switchcraft<br />
TA4F<br />
1<br />
2<br />
3<br />
4<br />
Shield<br />
Audio (+)<br />
Audio (-)<br />
+Vdc<br />
Appendix IV: Making Mic Cables<br />
Switchcraft<br />
A6M<br />
Switchcraft<br />
A3F<br />
Connect to<br />
<strong>Ivie</strong> <strong>IE</strong>-<strong>33</strong>M<br />
Measurement<br />
Microphone<br />
1<br />
2<br />
Audio (+)<br />
1<br />
2<br />
Connect to<br />
Standard<br />
3<br />
4<br />
Audio (-)<br />
+Vdc<br />
3<br />
No Connection<br />
Low-Z Dynamic<br />
Microphone<br />
Schematic for <strong>IE</strong>-<strong>33</strong>J to Dynamic Microphone Cable<br />
1<br />
2<br />
3<br />
4<br />
5<br />
6<br />
Schematic for <strong>Ivie</strong> Part# 2PMC-25 Extension Cable<br />
NC<br />
NC<br />
NC<br />
Connect to<br />
<strong>Ivie</strong> <strong>IE</strong>-2P<br />
with 1/2 inch<br />
Microphone<br />
Capsule<br />
page 43
Appendix V: Protecting Software<br />
<strong>IE</strong>-<strong>33</strong> Software Loss<br />
page 44<br />
<strong>Ivie</strong> <strong>IE</strong>-<strong>33</strong> & <strong>IE</strong>-<strong>35</strong> <strong>Manual</strong><br />
As described in Appendix I, page 36, the <strong>IE</strong>-<strong>33</strong> software and measurement data can be lost if the unit becomes<br />
fully discharged. Since the iPAQ does have some non-volatile memory available for use, the <strong>IE</strong>-<strong>33</strong> software can<br />
be stored as a CAB File in the non-volatile memory for easy installation, should the software ever get lost.<br />
The following instructions explain how this can be done:<br />
<strong>IE</strong>-<strong>33</strong> CAB File Installation and Use Instructions<br />
In the past, when the <strong>IE</strong>-<strong>33</strong> software became lost, it was possible to easily restore it using the "setup".exe file<br />
through the ActiveSync utility on your PC. The latest <strong>IE</strong>-<strong>33</strong> software has always been available for down load<br />
from our web site, www.ivie.com. While this process has been and continues to be available for use, there is<br />
now a second way to restore your <strong>IE</strong>-<strong>33</strong> software.<br />
Beginning with version 5.8.2, when you run the <strong>IE</strong>-<strong>33</strong> Setup.exe file, a file named "<strong>IE</strong><strong>33</strong>-Setup-v5.8.2ARM.CAB"<br />
will be created in file/directory on your PC from which you began the installation.<br />
Via ActiveSync, you can copy this file to the "iPAQ File Store" folder on your <strong>IE</strong>-<strong>33</strong> iPAQ. The iPAQ File Store<br />
folder is a non-volatile folder. Even if your iPAQ batteries are run down completely "flat," anything in the iPAQ<br />
File Store folder will remain in the iPAQ.<br />
By going to the iPAQ File Store folder and "double tapping" on the "<strong>IE</strong><strong>33</strong>-Setup-v5.8.2ARM.CAB" file, the <strong>IE</strong>-<strong>33</strong><br />
software will be installed from this non-volatile area into the folder from which the <strong>IE</strong>-<strong>33</strong> application needs to<br />
operate.<br />
Thus, by keeping a copy of the "CAB" file in the non-volatile iPAQ File Store area of your iPAQ, you can have an<br />
"emergency install" ready and in place, even if you find yourself in the field, away from a PC, when you have a<br />
need to reinstall.<br />
Special Note: The act of double tapping on the CAB file will cause the <strong>IE</strong>-<strong>33</strong> application software to be<br />
installed, but it will also erase the CAB file. If you want to have a permanent CAB file as an emergency install<br />
backup at all times, do this:<br />
Using the File Explorer in your iPAQ, or using File Explorer on your PC via ActiveSync, go the iPAQ File Store<br />
folder. Create a sub folder titled "Backup". Put a copy of the <strong>IE</strong>-<strong>33</strong> CAB file in the iPAQ File Store/Backup<br />
folder. Now, if you ever need to do an emergency install, simply make a copy of the CAB file into the iPAQ File<br />
Store folder, run it (double tap on it) from there. The CAB file you run will be erased as the install takes place,<br />
but the copy in the iPAQ File Store/Backup folder will remain.
<strong>Ivie</strong> <strong>IE</strong>-<strong>33</strong> & <strong>IE</strong>-<strong>35</strong> <strong>Manual</strong><br />
<strong>Ivie</strong> XLS Instructions<br />
Appendix VI: <strong>Ivie</strong>XLS<br />
The <strong>Ivie</strong>XLS software provided with the <strong>Ivie</strong> <strong>IE</strong>-<strong>33</strong> and <strong>Ivie</strong> <strong>IE</strong>-<strong>35</strong> is actually a template for the Microsoft® Excel®<br />
spreadsheet program. <strong>Ivie</strong>XLS will function properly with versions of Microsoft Excel versions 2000 or newer.<br />
(For purposes of brevity in this instruction set, the <strong>IE</strong>-<strong>33</strong> and the <strong>IE</strong>-<strong>35</strong> will be referred to as <strong>IE</strong>-<strong>33</strong>/<strong>35</strong>, since both<br />
function identically with <strong>Ivie</strong>XLS software).<br />
Before You Start the Software<br />
Before using <strong>Ivie</strong>XLS, you will need to transfer the data files of interest that were measured with the <strong>IE</strong>-<strong>33</strong>/<strong>35</strong> to<br />
your PC. This can be done using the standard Microsoft ActiveSync® software and connecting cables supplied<br />
with the PDA by which virtually all synchronization of files is done. Please refer to the instructions with your<br />
PDA on how to transfer files.<br />
Once the files of interest have been transferred to your PC, you are ready to begin using the <strong>Ivie</strong>XLS software.<br />
<strong>Ivie</strong> RTA files have the file extension, “.ivi”. <strong>Ivie</strong> Strip Chart files have the file extension “.cha”.<br />
Starting <strong>Ivie</strong>XLS<br />
When you are ready to start using <strong>Ivie</strong>XLS, do not start the Microsoft Excel application! Instead, you need to<br />
start the <strong>Ivie</strong>XLS template. The template is the file installed to your computer when you install <strong>Ivie</strong>XLS. That file<br />
is named something like “<strong>Ivie</strong>XLS ver. x.x.xls”. When you start the <strong>Ivie</strong>XLS template, it will automatically start<br />
Microsoft Excel. Note: If Excel is running when you start <strong>Ivie</strong>XLS, the <strong>Ivie</strong> charting application will not run properly.<br />
You MUST begin your session by starting <strong>Ivie</strong>XLS.<br />
Upon starting up the <strong>Ivie</strong>XLS application, a “permission screen” will pop up which will allow you to “enable<br />
macros.” You will need to enable macros in order for <strong>Ivie</strong>XLS to operate properly. If you don't see the enable<br />
macros screen during startup of <strong>Ivie</strong>XLS, check the security settings in Excel. You may need to alter your security<br />
settings.<br />
Once <strong>Ivie</strong>XLS starts, two windows will appear. The left window is the main chart screen, on which you will find<br />
the graphic depiction of your data. The right screen is a narrower control screen from which you will be able to<br />
set up the display in the main window.<br />
Control Panel<br />
Most of what you need to know to operate <strong>Ivie</strong>XLS deals with the right-hand control panel shown on the next<br />
page. Let's examine the control panel, from top to bottom. When we're done with the control panel, you will<br />
know most of what you need to know to begin the next step of experimenting with the <strong>Ivie</strong>XLS application itself.<br />
The upper-most panel on the control screen allows you to input the “Current Job Name.” <strong>Ivie</strong>XLS will remember<br />
that name from session to session and you can change it as needed. The job name is the description you<br />
will choose for the particular measurement, or series of measurements you are making. It can describe the<br />
measurement itself, or the venue where the measurement is being made, or whatever you want to see on the<br />
chart when you print it out.<br />
The “Edit” panel under Current Job Name is for entering your company information. The information you put<br />
here will be remembered from session to session, and will print on any of the forms that you print using <strong>Ivie</strong>XLS.<br />
The next panel down is “Data Sets.” This is the panel you will use to select the “.ivi” or “.cha” files you wish to<br />
display. The examples we will use in this instruction set will deal with “.ivi” files, as they are by far the most<br />
commonly used.<br />
“Data sets” are just that. When you bring a file over from your <strong>IE</strong>-<strong>33</strong>/<strong>35</strong>, it consists of ASCII, alpha numerical<br />
page 45
Appendix VI: <strong>Ivie</strong>XLS<br />
Use to enter or edit your<br />
company name.<br />
page 46<br />
Up to ten different data<br />
sets may be imported.<br />
Use to select<br />
display resolution.<br />
Use to average two or more<br />
displayed curves together.<br />
Use to subtract one curve<br />
from another.<br />
Use to select plot scale.<br />
Use to show NC or NR<br />
overlays.<br />
Use to add identifying<br />
notes to a data set.<br />
Use to display the<br />
data numerically.<br />
<strong>Ivie</strong> <strong>IE</strong>-<strong>33</strong> & <strong>IE</strong>-<strong>35</strong> <strong>Manual</strong><br />
Use to enter or edit<br />
current job name.<br />
Use to select data file for import<br />
from <strong>IE</strong>-<strong>33</strong> or <strong>IE</strong>-<strong>35</strong> to your PC.<br />
Use to select type of<br />
plot desired.<br />
Use to "overlay," or match one<br />
cuve to another.<br />
Use to select plot center level.<br />
Use to weight a plotted curve.<br />
Use to print a displayed plot.<br />
Use to save a data set.<br />
Use to get information about the<br />
version of <strong>Ivie</strong>XLS you are using.
<strong>Ivie</strong> <strong>IE</strong>-<strong>33</strong> & <strong>IE</strong>-<strong>35</strong> <strong>Manual</strong><br />
Appendix VI: <strong>Ivie</strong>XLS<br />
data that numerically represents all of the data recorded in that measurement. As you'll see a little later in this<br />
document, you can view the raw data as well as the graphical representations thereof.<br />
As you see from the Data Sets panel, you can select up to ten data sets (or curves) to display in the main data<br />
screen at one time. While having ten curves displayed at one time can, in some cases, be convenient, most<br />
times there would be too much “going on” in the display screen, if you were showing ten curves. Most users will<br />
find either a single curve, or perhaps two, three, or four curves about right. Nevertheless, experiment and see<br />
what makes sense for your application.<br />
To select a data file, click on the “Select Data File” button near the bottom of the Data Sets panel. You will be<br />
presented with a screen that facilitates file selection. In order to select the first file, click on the “1" button. You<br />
will be presented with a file navigation screen which will allow you to navigate through your PC's file folders to<br />
find the files you have transported from your PDA to your PC. Select the file of your choice.<br />
As <strong>Ivie</strong>XLS works to create the display of your file, be patient. <strong>Ivie</strong>XLS is processing 2048 data bins and allocating<br />
them into the proper position for the display. This can take a few seconds.<br />
Once you've selected the first file you want to view, you can repeat the process to add other files to be viewed<br />
on the same screen.<br />
Note that you can clear individual files from the control panel, replace files, add additional files, etc.<br />
When you are done selecting files, click on the “OK” button to come back to the main control panel.<br />
One of the first things you will want to do is select the display resolution of your data. With the four buttons<br />
immediately below the Data Sets panel, you will be able to select display resolutions of 1/1 octave, 1/3 octave,<br />
1/6 octave, or Max. Res*”.<br />
Note 1: The data brought across from your PDA to your PC is “raw” data, consisting of 2048 data points. The<br />
<strong>Ivie</strong>XLS template then processes the data for display in the user selectable resolutions. You can, therefore, look<br />
at any curve. In ANY resolution, even though the curve may have been stored in the 1/1 octave mode. It was<br />
not 1/1 octave data that was actually stored by the <strong>IE</strong>-<strong>33</strong>/<strong>35</strong>, but all 2048 data points. This stored data, then,<br />
can then be viewed in any of the available resolutions, either on the <strong>IE</strong>-<strong>33</strong>/<strong>35</strong>, or on your PC using <strong>Ivie</strong>XLS..<br />
Note 2: “Max Res” allocates the 2048 data points in the file for “maximum resolution.” In a practical sense, this<br />
means that the information above 125 Hz is displayed in about 1/24 octave resolution, while information below<br />
125 Hz is displayed in ever wider bandwidth equivalents as you go lower in frequency. <strong>Ivie</strong>XLS does not currently<br />
support displays recorded using Low Frequency Zoom on your <strong>IE</strong>-<strong>33</strong>/<strong>35</strong>.<br />
Once you have selected the resolution of the display (which you can go back and change at any time), you can<br />
select how you want to plot the information. “RTA Line” or “RTA Bar” selects how the information will be presented<br />
to you; in a line graph or a bar graph. Depending on the resolution you want, and the purpose for which you<br />
are creating the chart, select the type of display that best suits your needs.<br />
You will note that there is a check box labeled “Average.” If you have more than one curve on-screen, by checking<br />
Average, you can average the curves together to display one averaged curve. Uncheck the box and you will<br />
go back to the individual displays.<br />
By clicking on the “Delta” button, you are presented with a control screen that allows you to select any two of the<br />
curves you have on-screen (you must have at least two curves on-screen for this feature to be useful) and subtract<br />
one from the other. Just follow steps 1, 2, and 3 on the Delta control panel, then click on the “Plot” button<br />
and you will see the result in the main display area.<br />
Once the Delta curve is displayed, you can still change resolution, bar/line, scaling, etc. When you have the look<br />
you want, you can tap “Print Chart” and print out what is displayed in the main screen.<br />
page 47
Appendix VI: <strong>Ivie</strong>XLS<br />
page 48<br />
<strong>Ivie</strong> <strong>IE</strong>-<strong>33</strong> & <strong>IE</strong>-<strong>35</strong> <strong>Manual</strong><br />
When you are done with the Delta display, simply tap the “Return to Control Panel” button to return to the main<br />
control panel and the main display. Wait a sec!!! I've done that (you say) and the Delta display is still there.<br />
How can I get back to the regular display? You can't! (Just kidding) Simply tap any one of the resolution control<br />
buttons on the main control panel and you will be back to the main display.<br />
Curve Matching<br />
Let's talk about “Curve Matching.” In the course of making measurements in the field you may end up recording<br />
curves of the same source that were measured at different distances from that source. Later, you may wish to<br />
put these similar measurements on-screen together to see how they compare (to determine HF loss with distance,<br />
or perhaps uniformity of coverage from one location to another, etc.). But when you do so, there may be<br />
a level difference due to the different distances at which the curves were recorded.<br />
Curve Matching allows you to vertically move one curve with respect to the other on the screen so as to more<br />
closely overlay one on the other.<br />
To use Curve matching you must have at least two curves on-screen. Then click on the Curve Matching button.<br />
You will be presented with a Curve Matching control panel. It is similar to the Delta control panel. Just follow<br />
steps one and two in order to select the curve you want to be the Master Curve (the one that doesn't move and<br />
becomes the master for the other[s]), and to select the “Curve to Adjust”.<br />
Step three allows you to adjust the one curve relative to the other. Select Major or Minor adjustment (adjusts<br />
the amount of movement per click of the up/down arrows) and then use the arrows to move the “Curve to<br />
Adjust” up or down to lay it over or “match” the Master Curve.<br />
Tap the “Return to Control Panel” button to return to the main control panel. Tap any of the resolution buttons to<br />
remove the curve matching and return to the main display.<br />
dB Scale<br />
One of the adjustments you will want to experiment with is “dB Scale” selection. The dB Scale adjustment<br />
allows you to change between 5, 10, and 15 dB per division on the amplitude display of the main screen.<br />
Depending on what you want to see (details or trends, for example) in your display, you can adjust the dB Scale.<br />
In the same area of the main control panel you will find “dB Center.” This allows you to move the displayed<br />
curves vertically on the screen by changing the dB value of the horizontal center line of the main screen display.<br />
NC and NR Displays<br />
NC and NR gives you the ability to display NC (Noise Criteria) or NR (Noise Rating) overlays on-screen. Read<br />
the <strong>IE</strong>-<strong>33</strong>/<strong>35</strong> manual (page 18) for more information on NC and NR measurements.<br />
A and C Weighting<br />
The A Weight and C Weight selection boxes apply A or C weighting to the displayed curve(s). Sometimes you<br />
may wish to view the curve with weighting applied.<br />
Add Text Label<br />
The “Add Text Label” button brings up a sub control panel which allows you to create a text label and position it<br />
on the main display. This can be used to make special notes about particular characteristics of a curve, or just<br />
apply a general note on the main screen for printing or display. The note, or notes can be saved to the XLS file<br />
for future reference.<br />
Note that the “Add Text Label” function is just a simplified way of creating and adding notes. If one is familiar
<strong>Ivie</strong> <strong>IE</strong>-<strong>33</strong> & <strong>IE</strong>-<strong>35</strong> <strong>Manual</strong><br />
Appendix VI: <strong>Ivie</strong>XLS<br />
with Microsoft Excel, the normal Excel methods of adding and locating notes, etc., can be employed.<br />
Strip Chart<br />
The “Strip Chart” function in <strong>Ivie</strong>XLS is used to display the special “.cha” files that are created when using the<br />
Strip Chart function of the <strong>IE</strong>-<strong>33</strong>/<strong>35</strong>. Tapping the Strip Chart button presents the special control panel for this<br />
function.<br />
Use the Select Data File button to open the navigation screen in order to find the “.cha” strip chart file you want<br />
to display. Select the file and you will view its presentation in the main display window.<br />
Using the “Edit” button in the Strip Chart control panel, you can, if you wish, attach a job name to the display<br />
chart.<br />
Using the Zoom Level control in the Strip Chart control panel, you can choose how many data points you want<br />
to view per page, and how many pages or screens you want to use to divide up the display.<br />
Use the “Screens Control” to move from one screen to the next. (The left and right PC keyboard arrows will<br />
also page from screen to screen. As you are looking at the screen, you will notice a time reference at the bottom<br />
of the screen and amplitude reference on the left vertical axis of the screen.<br />
You can also use the “Add Text Label” control to put text notes on the screen to annotate certain events or areas<br />
of interest.<br />
Printing, Saving, Viewing Numerical Data<br />
Finally, you can print the chart or save it with your annotations for later review. Click on “Return to Control<br />
Panel” to come back to the main control panel.<br />
Print Chart<br />
“Print Chart” takes you automatically to the print function of your Widows based PC. Your main display screen<br />
will print.<br />
Save As<br />
“Save As” takes you to a standard Windows screen that will allow you to save your work to a file in the location<br />
of your choice on your hard drive.<br />
Table of Levels<br />
The “Table of Levels” function presents on-screen, the actual numerical data that is used to build the graphic displays<br />
for different resolutions. This is not the “raw” data, but rather the amplitude data for each of the octave<br />
band resolutions: 1/1, 1/3, 1/6. In some instances, it can be useful to view the numerical data. Table of Levels<br />
allows you to do this.<br />
At this point, you should have most everything you need to begin navigating the <strong>Ivie</strong>XLS application. It will take<br />
some experimentation and practice to determine the best way to format, display and print the data for your specific<br />
requirements.<br />
page 49
Index<br />
page 50<br />
<strong>Ivie</strong> <strong>IE</strong>-<strong>33</strong> & <strong>IE</strong>-<strong>35</strong> <strong>Manual</strong><br />
A" and "C" Curves ------------------------------------------------------------------------------------------------------------- page 26<br />
Average Display On/Off ------------------------------------------------------------------------------------------------------ page 12<br />
Average Mode ------------------------------------------------------------------------------------------------------------------- page 22<br />
Average Type Selection ------------------------------------------------------------------------------------------------------ page 22<br />
Beginning to Use the <strong>IE</strong>-<strong>33</strong> or <strong>IE</strong>-<strong>35</strong> --------------------------------------------------------------------------------------- page 10<br />
Calibration (<strong>IE</strong>-<strong>33</strong> and <strong>IE</strong>-<strong>35</strong> Microphone) ---------------------------------------------------------------------------------- page 41<br />
Continuous Average Mode --------------------------------------------------------------------------------------------------- page 22<br />
Creating a Preferred Curve ------------------------------------------------------------------------------------------------ page 14<br />
Data and Program Transfer -------------------------------------------------------------------------------------------------- page 42<br />
Data Storage on the iPAQ --------------------------------------------------------------------------------------------------- page 42<br />
dB Volts (dBV) ------------------------------------------------------------------------------------------------------------------- page 38<br />
dB Volts Unterminated (dBu) ---------------------------------------------------------------------------------------------- page 38<br />
Decay ------------------------------------------------------------------------------------------------------------------------------ page 12<br />
Diagnostics ----------------------------------------------------------------------------------------------------------------------- page 36<br />
Dual Trace or XY Measurements -------------------------------------------------------------------------------------------- page 36<br />
Exiting or Shutting Down Other PDA Applications --------------------------------------------------------------------- page 40<br />
Frequency and Amplitude Detection --------------------------------------------------------------------------------------- page 16<br />
Frequency Detect --------------------------------------------------------------------------------------------------------------- page 16<br />
Getting Started with Your <strong>IE</strong>-<strong>33</strong> or <strong>IE</strong>-<strong>35</strong> -------------------------------------------------------------------------------- page 10<br />
Hardware Buttons (<strong>IE</strong>-<strong>33</strong>) -------------------------------------------------------------------------------------------------- page 6<br />
Hardware Buttons (<strong>IE</strong>-<strong>35</strong>) -------------------------------------------------------------------------------------------------- page 8<br />
<strong>IE</strong>-<strong>33</strong> CAB File Installation and Use Instructions ------------------------------------------------------------------- page 44<br />
<strong>IE</strong>-<strong>33</strong> Controls --------------------------------------------------------------------------------------------------------------------- page 6<br />
<strong>IE</strong>-<strong>35</strong> Controls --------------------------------------------------------------------------------------------------------------------- page 8<br />
<strong>IE</strong>-<strong>33</strong> or <strong>IE</strong>-<strong>35</strong> Display Appears to be Running in "Slow Motion" ------------------------------------------------------ page 40<br />
<strong>IE</strong>-<strong>33</strong> Jacket & <strong>IE</strong>-<strong>35</strong> PAL: Data and Program Transfer --------------------------------------------------------- pages 10, 42<br />
Input Select ------------------------------------------------------------------------------------------------------------------------ page 36<br />
Installing <strong>IE</strong>-<strong>33</strong>, or <strong>IE</strong>-<strong>35</strong> Software or Software Updates ----------------------------------------------------------- page 42<br />
Introduction ----------------------------------------------------------------------------------------------------------------------- page 6<br />
iPAQ and Axim Buttons ----------------------------------------------------------------------------------------------------------- page 12<br />
<strong>Ivie</strong>XLS Instructions (Appendix VI) ------------------------------------------------------------------------------------------ page 45<br />
LED Display --------------------------------------------------------------------------------------------------------------------- page 14<br />
Loading a Preferred Curve from Memory -------------------------------------------------------------------------------- page 12<br />
Making a Seat-to-Seat Measurement ------------------------------------------------------------------------------------- page 30<br />
Making SPL Measurements -------------------------------------------------------------------------------------------------- page 28<br />
Making Your Own Mic Cables ----------------------------------------------------------------------------------------------- page 43<br />
Measuring Voltages and Viewing Spectral Information Simultaneously -------------------------------------------- page 38<br />
Memory Control Buttons ------------------------------------------------------------------------------------------------------ page 18<br />
Memory Cursor ------------------------------------------------------------------------------------------------------------------ page 16<br />
Memory File Format ------------------------------------------------------------------------------------------------------------ page 18<br />
Memory Functions -------------------------------------------------------------------------------------------------------------- page 18<br />
Memory Management --------------------------------------------------------------------------------------------------------- page 18<br />
Memory Stylus Buttons ------------------------------------------------------------------------------------------------------ page 12<br />
Microphone Cables (Making Your Own) ---------------------------------------------------------------------------------- page 42<br />
Microphone Calibration ------------------------------------------------------------------------------------------------------ page 10<br />
Microphone Calibration Procedure ----------------------------------------------------------------------------------------- page 41<br />
My Data, Applications, Measurements - Gone! All Gone! ----------------------------------------------------------- page 40
<strong>Ivie</strong> <strong>IE</strong>-<strong>33</strong> & <strong>IE</strong>-<strong>35</strong> <strong>Manual</strong><br />
Index<br />
NC and NR Averaging --------------------------------------------------------------------------------------------------------- page 24<br />
NIC Measurements ------------------------------------------------------------------------------------------------------------- page 20<br />
Nixie Tube Readout ----------------------------------------------------------------------------------------------------------- page 38<br />
Noise Criteria (NC) and Noise Rating (NR) Measurements ---------------------------------------------------- page 24<br />
Oscilloscope (Scope) ---------------------------------------------------------------------------------------------------------- page 36<br />
Peak Cursor ---------------------------------------------------------------------------------------------------------------------- page 16<br />
Peak Hold Curves --------------------------------------------------------------------------------------------------------------- page 16<br />
Peak Storage -------------------------------------------------------------------------------------------------------------------- page 18<br />
Polarity --------------------------------------------------------------------------------------------------------------------------- page 34<br />
Pop-Up Menus ----------------------------------------------------------------------------------------------------------------- page 12<br />
Pop-Up Menus (<strong>IE</strong>-<strong>33</strong>) ----------------------------------------------------------------------------------------------------- page 8<br />
Pop-Up Menus (<strong>IE</strong>-<strong>35</strong>) ------------------------------------------------------------------------------------------------------ page 8<br />
Potential Data Loss -------------------------------------------------------------------------------------------------------------- page 6<br />
Power Average / Arithmetic Average -------------------------------------------------------------------------------------- page 36<br />
Preferences Menu -------------------------------------------------------------------------------------------------------------- page 36<br />
Preferred Curve ----------------------------------------------------------------------------------------------------------------- page 12<br />
Preferred Curve Overlay ------------------------------------------------------------------------------------------------------ page 14<br />
Real Time Analyzer Controls --------------------------------------------------------------------------------------------- page 12<br />
Real Time NIC Measurements ------------------------------------------------------------------------------------------- page 20<br />
RTA Cursor --------------------------------------------------------------------------------------------------------------------- page 16<br />
RTA Display On/Off ----------------------------------------------------------------------------------------------------------- page 12<br />
Saving a Preferred Curve ------------------------------------------------------------------------------------------------------ page 14<br />
Signal Generator ----------------------------------------------------------------------------------------------------------------- page 36<br />
Simple Trouble-Shooting ------------------------------------------------------------------------------------------------------ page 40<br />
Scratch Memories -------------------------------------------------------------------------------------------------------------- page 18<br />
Software Loss ------------------------------------------------------------------------------------------------------------------- page 44<br />
Sound Level Measurement --------------------------------------------------------------------------------------------------- page 26<br />
Sound Pressure Level (SPL) Monitor -------------------------------------------------------------------------------------- page 28<br />
Sound Pressure Level (SPL) Seat-to-Seat ------------------------------------------------------------------------------- page 30<br />
SPL Readout Stylus Button ---------------------------------------------------------------------------------------------------- page 12<br />
SPL Weighting and the RTA Display ------------------------------------------------------------------------------------- page 14<br />
Start/Stop Stylus Button ------------------------------------------------------------------------------------------------------- page 12<br />
Storing and Loading an Average Curve ---------------------------------------------------------------------------------- page 22<br />
Strip Chart ------------------------------------------------------------------------------------------------------------------------ page 32<br />
Stylus Buttons ------------------------------------------------------------------------------------------------------------------ page 12<br />
Stylus Buttons (<strong>IE</strong>-<strong>33</strong>) ------------------------------------------------------------------------------------------------------ page 6<br />
Stylus Buttons (<strong>IE</strong>-<strong>35</strong>) ------------------------------------------------------------------------------------------------------ page 8<br />
Stylus Button Colors ---------------------------------------------------------------------------------------------------------- page 18<br />
Subtract Feature ---------------------------------------------------------------------------------------------------------------- page 18<br />
System Calibration for OSHA Measurements --------------------------------------------------------------------------- page 28<br />
The <strong>IE</strong>-<strong>33</strong>, or <strong>IE</strong>-<strong>35</strong>, Appears to be Running in "Slow Motion" -------------------------------------------------------- page 40<br />
Transferring Data --------------------------------------------------------------------------------------------------------------- page 42<br />
Triggered Average Mode ----------------------------------------------------------------------------------------------------- page 22<br />
Viewing an Average Curve -------------------------------------------------------------------------------------------------- page 22<br />
Volt Meter ------------------------------------------------------------------------------------------------------------------------ page 38<br />
Volts Peak to Peak (Volts PP) ----------------------------------------------------------------------------------------------- page 38<br />
Volts RMS ------------------------------------------------------------------------------------------------------------------------- page 38<br />
page 51