- Page 2 and 3: A Textbook of Clinical Pharmacology
- Page 4 and 5: A Textbook of Clinical Pharmacology
- Page 6 and 7: This fifth edition is dedicated to
- Page 8 and 9: CONTENTS FOREWORD PREFACE ACKNOWLED
- Page 10 and 11: PREFACE Clinical pharmacology is th
- Page 12 and 13: PART I GENERAL PRINCIPLES
- Page 14 and 15: CHAPTER 1 INTRODUCTION TO THERAPEUT
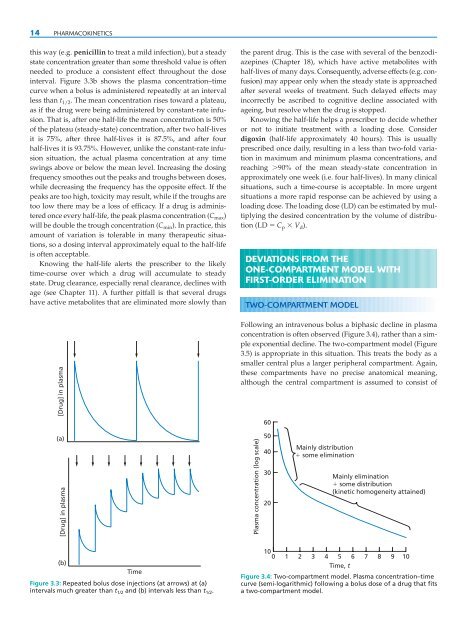
- Page 16 and 17: SCIENTIFIC BASIS OF USE OF DRUGS IN
- Page 18 and 19: AGONISTS 7 100 100 Effect (%) Effec
- Page 20 and 21: SLOW PROCESSES 9 100 2 Dose ratio -
- Page 22 and 23: CHAPTER 3 PHARMACOKINETICS ● Intr
- Page 26 and 27: NON-LINEAR (‘DOSE-DEPENDENT’) P
- Page 28 and 29: CHAPTER 4 DRUG ABSORPTION AND ROUTE
- Page 30 and 31: ROUTES OF ADMINISTRATION 19 ROUTES
- Page 32 and 33: ROUTES OF ADMINISTRATION 21 Transde
- Page 34 and 35: ROUTES OF ADMINISTRATION 23 FURTHER
- Page 36 and 37: PHASE II METABOLISM (TRANSFERASE RE
- Page 38 and 39: ENZYME INDUCTION 27 and lorazepam.
- Page 40 and 41: METABOLISM OF DRUGS BY INTESTINAL O
- Page 42 and 43: CHAPTER 6 RENAL EXCRETION OF DRUGS
- Page 44 and 45: ACTIVE TUBULAR REABSORPTION 33 ACTI
- Page 46 and 47: RENAL DISEASE 35 DISTRIBUTION Drug
- Page 48 and 49: LIVER DISEASE 37 Detailed recommend
- Page 50 and 51: THYROID DISEASE 39 DIGOXIN Myxoedem
- Page 52 and 53: CHAPTER 8 THERAPEUTIC DRUG MONITORI
- Page 54 and 55: DRUGS FOR WHICH THERAPEUTIC DRUG MO
- Page 56 and 57: CHAPTER 9 DRUGS IN PREGNANCY ● In
- Page 58 and 59: PHARMACOKINETICS IN PREGNANCY 47 va
- Page 60 and 61: PRESCRIBING IN PREGNANCY 49 an anti
- Page 62 and 63: PRESCRIBING IN PREGRANCY 51 Case hi
- Page 64 and 65: BREAST-FEEDING 53 METABOLISM At bir
- Page 66 and 67: RESEARCH 55 lifelong effects as a r
- Page 68 and 69: PHARMACODYNAMIC CHANGES 57 DISTRIBU
- Page 70 and 71: EFFECT OF DRUGS ON SOME MAJOR ORGAN
- Page 72 and 73: RESEARCH 61 FURTHER READING Dhesi J
- Page 74 and 75:
ADVERSE DRUG REACTION MONITORING/SU
- Page 76 and 77:
ADVERSE DRUG REACTION MONITORING/SU
- Page 78 and 79:
PREVENTION OF ALLERGIC DRUG REACTIO
- Page 80 and 81:
EXAMPLES OF ALLERGIC AND OTHER ADVE
- Page 82 and 83:
CHAPTER 13 DRUG INTERACTIONS ● In
- Page 84 and 85:
HARMFUL INTERACTIONS 73 Response Re
- Page 86 and 87:
HARMFUL INTERACTIONS 75 Table 13.1:
- Page 88 and 89:
HARMFUL INTERACTIONS 77 Table 13.5:
- Page 90 and 91:
CHAPTER 14 PHARMACOGENETICS ● Int
- Page 92 and 93:
GENETIC INFLUENCES ON DRUG METABOLI
- Page 94 and 95:
INHERITED DISEASES THAT PREDISPOSE
- Page 96 and 97:
INHERITED DISEASES THAT PREDISPOSE
- Page 98 and 99:
CLINICAL TRIALS 87 • Discovery
- Page 100 and 101:
CLINICAL DRUG DEVELOPMENT 89 Too ma
- Page 102 and 103:
GLOBALIZATION 91 ETHICS COMMITTEES
- Page 104 and 105:
CELL-BASED AND RECOMBINANT DNA THER
- Page 106 and 107:
HUMAN STEM CELL THERAPY 95 duration
- Page 108 and 109:
CHAPTER 17 ALTERNATIVE MEDICINES: H
- Page 110 and 111:
SOY 99 A case report has suggested
- Page 112 and 113:
MISCELLANEOUS HERBS 101 including h
- Page 114 and 115:
PART II THE NERVOUS SYSTEM
- Page 116 and 117:
CHAPTER 18 HYPNOTICS AND ANXIOLYTIC
- Page 118 and 119:
ANXIETY 107 and daytime sleeping sh
- Page 120 and 121:
ANXIETY 109 Key points • Insomnia
- Page 122 and 123:
SCHIZOPHRENIA 111 Box 19.1: Dopamin
- Page 124 and 125:
SCHIZOPHRENIA 113 The Boston Collab
- Page 126 and 127:
BEHAVIOURAL EMERGENCIES 115 Oral me
- Page 128 and 129:
DEPRESSIVE ILLNESSES AND ANTIDEPRES
- Page 130 and 131:
DEPRESSIVE ILLNESSES AND ANTIDEPRES
- Page 132 and 133:
LITHIUM, TRYPTOPHAN AND ST JOHN’S
- Page 134 and 135:
SPECIAL GROUPS 123 Case history A 4
- Page 136 and 137:
PARKINSON’S SYNDROME AND ITS TREA
- Page 138 and 139:
PARKINSON’S SYNDROME AND ITS TREA
- Page 140 and 141:
MYASTHENIA GRAVIS 129 CHOREA The γ
- Page 142 and 143:
ALZHEIMER’S DISEASE 131 Cholinerg
- Page 144 and 145:
CHAPTER 22 ANTI-EPILEPTICS ● Intr
- Page 146 and 147:
GENERAL PRINCIPLES OF TREATMENT OF
- Page 148 and 149:
GENERAL PRINCIPLES OF TREATMENT OF
- Page 150 and 151:
WITHDRAWAL OF ANTI-EPILEPTIC DRUGS
- Page 152 and 153:
FEBRILE CONVULSIONS 141 Case histor
- Page 154 and 155:
DRUGS USED FOR MIGRAINE PROPHYLAXIS
- Page 156 and 157:
CHAPTER 24 ANAESTHETICS AND MUSCLE
- Page 158 and 159:
INHALATIONAL ANAESTHETICS 147 is th
- Page 160 and 161:
SUPPLEMENTARY DRUGS 149 • Respira
- Page 162 and 163:
MUSCLE RELAXANTS 151 NON-DEPOLARIZI
- Page 164 and 165:
LOCAL ANAESTHETICS 153 have also pr
- Page 166 and 167:
CHAPTER 25 ANALGESICS AND THE CONTR
- Page 168 and 169:
DRUGS USED TO TREAT MILD OR MODERAT
- Page 170 and 171:
OPIOIDS 159 Key points Drugs for mi
- Page 172 and 173:
OPIOIDS 161 increases, correlating
- Page 174 and 175:
MANAGEMENT OF POST-OPERATIVE PAIN 1
- Page 176 and 177:
PART III THE MUSCULOSKELETAL SYSTEM
- Page 178 and 179:
CHAPTER 26 ANTI-INFLAMMATORY DRUGS
- Page 180 and 181:
DISEASE-MODIFYING ANTIRHEUMATIC DRU
- Page 182 and 183:
HYPERURICAEMIA AND GOUT 171 • Sto
- Page 184 and 185:
HYPERURICAEMIA AND GOUT 173 Pharmac
- Page 186 and 187:
PART IV THE CARDIOVASCULAR SYSTEM
- Page 188 and 189:
CHAPTER 27 PREVENTION OF ATHEROMA:
- Page 190 and 191:
PREVENTION OF ATHEROMA 179 responsi
- Page 192 and 193:
DRUGS USED TO TREAT DYSLIPIDAEMIA 1
- Page 194 and 195:
DRUGS USED TO TREAT DYSLIPIDAEMIA 1
- Page 196 and 197:
CHAPTER 28 HYPERTENSION ● Introdu
- Page 198 and 199:
DRUGS USED TO TREAT HYPERTENSION 18
- Page 200 and 201:
DRUGS USED TO TREAT HYPERTENSION 18
- Page 202 and 203:
DRUGS USED TO TREAT HYPERTENSION 19
- Page 204 and 205:
OTHER ANTIHYPERTENSIVE DRUGS 193 Ke
- Page 206 and 207:
OTHER ANTIHYPERTENSIVE DRUGS 195 Ca
- Page 208 and 209:
MANAGEMENT OF STABLE ANGINA 197 Ass
- Page 210 and 211:
MANAGEMENT OF UNSTABLE CORONARY DIS
- Page 212 and 213:
DRUGS USED IN ISCHAEMIC HEART DISEA
- Page 214 and 215:
DRUGS USED IN ISCHAEMIC HEART DISEA
- Page 216 and 217:
ANTICOAGULANTS 205 Intrinsic pathwa
- Page 218 and 219:
ANTICOAGULANTS 207 that the pharmac
- Page 220 and 221:
ANTICOAGULANTS IN PREGNANCY AND PUE
- Page 222 and 223:
CHAPTER 31 HEART FAILURE ● Introd
- Page 224 and 225:
DRUGS FOR HEART FAILURE 213 The dru
- Page 226 and 227:
DRUGS FOR HEART FAILURE 215 therape
- Page 228 and 229:
CHAPTER 32 CARDIAC DYSRHYTHMIAS ●
- Page 230 and 231:
CARDIOPULMONARY RESUSCITATION AND C
- Page 232 and 233:
TREATMENT OF OTHER SPECIFIC DYSRHYT
- Page 234 and 235:
SELECTED ANTI-DYSRHYTHMIC DRUGS 223
- Page 236 and 237:
SELECTED ANTI-DYSRHYTHMIC DRUGS 225
- Page 238 and 239:
SELECTED ANTI-DYSRHYTHMIC DRUGS 227
- Page 240 and 241:
SELECTED ANTI-DYSRHYTHMIC DRUGS 229
- Page 242 and 243:
PART V THE RESPIRATORY SYSTEM
- Page 244 and 245:
CHAPTER 33 THERAPY OF ASTHMA, CHRON
- Page 246 and 247:
CHRONIC BRONCHITIS AND EMPHYSEMA 23
- Page 248 and 249:
DRUGS USED TO TREAT ASTHMA AND CHRO
- Page 250 and 251:
DRUGS USED TO TREAT ASTHMA AND CHRO
- Page 252 and 253:
RESPIRATORY FAILURE 241 use in asth
- Page 254 and 255:
DRUG-INDUCED PULMONARY DISEASE 243
- Page 256 and 257:
PART VI THE ALIMENTARY SYSTEM
- Page 258 and 259:
CHAPTER 34 ALIMENTARY SYSTEM AND LI
- Page 260 and 261:
PEPTIC ULCERATION 249 • With rega
- Page 262 and 263:
PEPTIC ULCERATION 251 Ranitidine ha
- Page 264 and 265:
ANTI-EMETICS 253 Vestibular stimula
- Page 266 and 267:
INFLAMMATORY BOWEL DISEASE 255 cort
- Page 268 and 269:
CONSTIPATION 257 • in hepatocellu
- Page 270 and 271:
PANCREATIC INSUFFICIENCY 259 Ciprof
- Page 272 and 273:
LIVER DISEASE 261 withdrawal), smal
- Page 274 and 275:
DRUGS THAT MODIFY APPETITE 263 Tabl
- Page 276 and 277:
CHAPTER 35 VITAMINS AND TRACE ELEME
- Page 278 and 279:
VITAMIN C(ASCORBIC ACID) 267 dinucl
- Page 280 and 281:
TRACE ELEMENTS 269 Table 35.1: Comm
- Page 282 and 283:
PART VII FLUIDS AND ELECTROLYTES
- Page 284 and 285:
CHAPTER 36 NEPHROLOGICAL AND RELATE
- Page 286 and 287:
DIURETICS 275 Key points Diuretics
- Page 288 and 289:
VOLUME DEPLETION 277 is sometimes c
- Page 290 and 291:
DRUGS THAT AFFECT THE BLADDER AND G
- Page 292 and 293:
DRUGS THAT AFFECT THE BLADDER AND G
- Page 294 and 295:
PART VIII THE ENDOCRINE SYSTEM
- Page 296 and 297:
CHAPTER 37 DIABETES MELLITUS ● In
- Page 298 and 299:
DRUGS USED TO TREAT DIABETES MELLIT
- Page 300 and 301:
DRUGS USED TO TREAT DIABETES MELLIT
- Page 302 and 303:
DRUGS USED TO TREAT DIABETES MELLIT
- Page 304 and 305:
ANTITHYROID DRUGS 293 deficiency. P
- Page 306 and 307:
SPECIAL SITUATIONS 295 fertility. I
- Page 308 and 309:
CHAPTER 39 CALCIUM METABOLISM ● I
- Page 310 and 311:
BISPHOSPHONATES 299 effective in li
- Page 312 and 313:
CINACALCET 301 Further reading Bloc
- Page 314 and 315:
ADRENAL CORTEX 303 Table 40.1: Acti
- Page 316 and 317:
ADRENAL MEDULLA 305 injection may b
- Page 318 and 319:
CHAPTER 41 REPRODUCTIVE ENDOCRINOLO
- Page 320 and 321:
FEMALE REPRODUCTIVE ENDOCRINOLOGY 3
- Page 322 and 323:
FEMALE REPRODUCTIVE ENDOCRINOLOGY 3
- Page 324 and 325:
MALE REPRODUCTIVE ENDOCRINOLOGY 313
- Page 326 and 327:
MALE REPRODUCTIVE ENDOCRINOLOGY 315
- Page 328 and 329:
ANTERIOR PITUITARY HARMONES AND REL
- Page 330 and 331:
POSTERIOR PITUITARY HARMONES 319 FU
- Page 332 and 333:
PART IX SELECTIVE TOXICITY
- Page 334 and 335:
CHAPTER 43 ANTIBACTERIAL DRUGS ●
- Page 336 and 337:
COMMONLY PRESCRIBED ANTIBACTERIAL D
- Page 338 and 339:
COMMONLY PRESCRIBED ANTIBACTERIAL D
- Page 340 and 341:
COMMONLY PRESCRIBED ANTIBACTERIAL D
- Page 342 and 343:
COMMONLY PRESCRIBED ANTIBACTERIAL D
- Page 344 and 345:
COMMONLY PRESCRIBED ANTIBACTERIAL D
- Page 346 and 347:
PRINCIPLES OF MANAGEMENT OF MYCOBAC
- Page 348 and 349:
FIRST-LINE DRUGS IN TUBERCULOSIS TH
- Page 350 and 351:
MYCOBACTERIUM LEPRAE INFECTION 339
- Page 352 and 353:
ANTIFUNGAL DRUG THERAPY 341 POLYENE
- Page 354 and 355:
ANTIFUNGAL DRUG THERAPY 343 therapy
- Page 356 and 357:
ANTIVIRAL DRUG THERAPY (EXCLUDING A
- Page 358 and 359:
ANTIVIRAL DRUG THERAPY (EXCLUDING A
- Page 360 and 361:
INTERFERONS AND ANTIVIRAL HEPATITIS
- Page 362 and 363:
CHAPTER 46 HIV AND AIDS ● Introdu
- Page 364 and 365:
ANTI-HIV DRUGS 353 Table 46.1: Exam
- Page 366 and 367:
ANTI-HIV DRUGS 355 NON-NUCLEOSIDE A
- Page 368 and 369:
OPPORTUNISTIC INFECTIONS IN HIV-1-S
- Page 370 and 371:
ANTI-HERPES VIRUS THERAPY 359 salva
- Page 372 and 373:
CHAPTER 47 MALARIA AND OTHER PARASI
- Page 374 and 375:
MALARIA 363 Pharmacokinetics Chloro
- Page 376 and 377:
HELMINTHIC INFECTION 365 Table 47.2
- Page 378 and 379:
CHAPTER 48 CANCER CHEMOTHERAPY ●
- Page 380 and 381:
COMMON COMPLICATIONS OF CANCER CHEM
- Page 382 and 383:
DRUGS USED IN CANCER CHEMOTHERAPY 3
- Page 384 and 385:
DRUGS USED IN CANCER CHEMOTHERAPY 3
- Page 386 and 387:
DRUGS USED IN CANCER CHEMOTHERAPY 3
- Page 388 and 389:
DRUGS USED IN CANCER CHEMOTHERAPY 3
- Page 390 and 391:
DRUGS USED IN CANCER CHEMOTHERAPY 3
- Page 392 and 393:
DRUGS USED IN CANCER CHEMOTHERAPY 3
- Page 394 and 395:
DRUGS USED IN CANCER CHEMOTHERAPY 3
- Page 396 and 397:
DRUGS USED IN CANCER CHEMOTHERAPY 3
- Page 398 and 399:
PART X HAEMATOLOGY
- Page 400 and 401:
CHAPTER 49 ANAEMIA AND OTHER HAEMAT
- Page 402 and 403:
HAEMATINICS - IRON, VITAMIN B 12 AN
- Page 404 and 405:
HAEMATOPOIETIC GROWTH FACTORS 393 S
- Page 406 and 407:
IDIOPATHIC THROMBOCYTOPENIC PURPURA
- Page 408 and 409:
PART XI IMMUNOPHARMACOLOGY
- Page 410 and 411:
CHAPTER 50 CLINICAL IMMUNOPHARMACOL
- Page 412 and 413:
IMMUNOSUPPRESSIVE AGENTS 401 Ag Ant
- Page 414 and 415:
IMMUNOSUPPRESSIVE AGENTS 403 Table
- Page 416 and 417:
CHEMICAL MEDIATORS OF THE IMMUNE RE
- Page 418 and 419:
IMMUNOGLOBULINS AS THERAPY 407 DRUG
- Page 420 and 421:
PART XII THE SKIN
- Page 422 and 423:
CHAPTER 51 DRUGS AND THE SKIN ● I
- Page 424 and 425:
DERMATITIS (ECZEMA) 413 Avoid preci
- Page 426 and 427:
PSORIASIS 415 Emollients Improving
- Page 428 and 429:
ADVERSE DRUG REACTIONS INVOLVING TH
- Page 430 and 431:
ADVERSE DRUG REACTIONS INVOLVING TH
- Page 432 and 433:
PART XIII THE EYE
- Page 434 and 435:
CHAPTER 52 DRUGS AND THE EYE ● In
- Page 436 and 437:
DRUGS USED TO CONSTRICT THE PUPIL A
- Page 438 and 439:
DRUGS USED TO TREAT INFLAMMATORY DI
- Page 440 and 441:
CONTACT LENS WEARERS 429 Table 52.6
- Page 442 and 443:
PART XIV CLINICAL TOXICOLOGY
- Page 444 and 445:
CHAPTER 53 DRUGS AND ALCOHOL ABUSE
- Page 446 and 447:
OPIOID/NARCOTIC ANALGESICS 435 Tabl
- Page 448 and 449:
DRUGS THAT ALTER PERCEPTION 437 whi
- Page 450 and 451:
CENTRAL DEPRESSANTS 439 Peak plasma
- Page 452 and 453:
CENTRAL DEPRESSANTS 441 Key points
- Page 454 and 455:
MISCELLANEOUS 443 FURTHER READING G
- Page 456 and 457:
INTENTIONAL SELF-POISONING 445 Tabl
- Page 458 and 459:
INTENTIONAL SELF-POISONING 447 Tabl
- Page 460 and 461:
CRIMINAL POISONING 449 Commission o
- Page 462 and 463:
INDEX Note: Page numbers in italics
- Page 464 and 465:
INDEX 453 atrial fibrillation 217,
- Page 466 and 467:
INDEX 455 Cushing’s syndrome 302
- Page 468 and 469:
INDEX 457 5-fluorouracil 375-6 fluo
- Page 470 and 471:
INDEX 459 children 54 diazepam 108
- Page 472 and 473:
INDEX 461 non-steroidal anti-inflam
- Page 474 and 475:
INDEX 463 puberty (male), delay 314
- Page 476:
INDEX 465 tolerance 9, 433 benzodia