Annual Report - 2005-06 - GAIL (India)
Annual Report - 2005-06 - GAIL (India)
Annual Report - 2005-06 - GAIL (India)

Create successful ePaper yourself
Turn your PDF publications into a flip-book with our unique Google optimized e-Paper software.
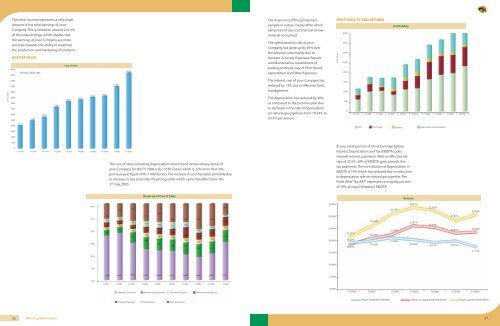
The other income represents a very small<br />
amount of the total earnings of your<br />
Company. This is limited to around 2 to 3%<br />
of the total earnings, which implies that<br />
the earnings of your Company are more<br />
sensitive towards the ability to maximize<br />
the production and marketing of products.<br />
COST OF SALES<br />
14000<br />
13000<br />
10 Year CAGR 13%<br />
Cost of Sales<br />
13530<br />
The major cost of the Company is<br />
variable in nature (nearly 90%) which<br />
comprises of Gas cost and cost of raw<br />
material consumed.<br />
The administrative cost of your<br />
Company has gone up by 49% over<br />
the previous year mainly due to<br />
increase in Survey Expenses, Repairs<br />
and Maintenance, restatement of<br />
trading profits by way of Prior Period<br />
expenditure and Other Expenses.<br />
PROFITABILITY AND RETURNS<br />
in Rs. Crores<br />
4000<br />
3500<br />
3000<br />
2500<br />
2000<br />
Profitability<br />
in Rs. Crores<br />
12000<br />
11000<br />
10000<br />
9000<br />
8000<br />
7000<br />
6000<br />
5000<br />
4946<br />
5590<br />
7365<br />
8415<br />
8717<br />
9144<br />
9372<br />
11<strong>06</strong>9<br />
The interest cost of your Company has<br />
reduced by 13% due to effective fund<br />
management.<br />
The depreciation has reduced by 40%<br />
as compared to the previous year due<br />
to decrease in the rate of depreciation<br />
on natural gas pipelines from 10.34% to<br />
3.17% per annum.<br />
1500<br />
1000<br />
500<br />
0<br />
FY1997 FY1998 FY1999 FY2000 FY2001 FY2002 FY2003 FY2004 FY<strong>2005</strong> FY20<strong>06</strong><br />
4000<br />
4115<br />
PAT Tax Charges Interest Depreciation & Amortization<br />
3000<br />
2000<br />
1000<br />
0<br />
FY1997 FY1998 FY1999 FY2000 FY2001 FY2002 FY2003 FY2004 FY<strong>2005</strong> FY20<strong>06</strong><br />
The cost of sales (including Depreciation, Interest and extraordinary items) of<br />
your Company for the FY 20<strong>06</strong> is Rs.13530 Crores which is 22% more than the<br />
previous year figure of Rs.11<strong>06</strong>9 Crores. The increase in cost has been primarily due<br />
to increase in Gas Cost vide the pricing order which came into effect from the<br />
1st July, <strong>2005</strong>.<br />
A very small portion of 3% of Earnings before<br />
Interest, Depreciation and Tax (EBIDTA) goes<br />
towards interest payments. With an effective tax<br />
rate of 29.5%, 24% of EBIDTA goes towards the<br />
tax payments. The contribution of depreciation in<br />
EBIDTA is 14% which has reduced due to reduction<br />
in depreciation rate on natural gas pipeline. The<br />
Profit After Tax (PAT) represents a majority portion<br />
of 59% of your Company’s EBIDTA.<br />
Break-up of Cost of Sales<br />
Returns<br />
100%<br />
95%<br />
90%<br />
85%<br />
235<br />
61<br />
5<br />
76<br />
41<br />
94<br />
251<br />
65<br />
5<br />
74<br />
56<br />
116<br />
381<br />
92<br />
4<br />
87<br />
79<br />
238<br />
492<br />
167<br />
18<br />
158<br />
127<br />
348<br />
587<br />
197<br />
29<br />
183<br />
146<br />
395<br />
613<br />
227<br />
42<br />
183<br />
148<br />
389<br />
643<br />
186<br />
47<br />
348<br />
158<br />
432<br />
664<br />
138<br />
51<br />
215<br />
174<br />
486<br />
947<br />
134<br />
54<br />
285<br />
2<strong>06</strong><br />
520<br />
559<br />
117<br />
55<br />
424<br />
222<br />
632<br />
35.00%<br />
30.00%<br />
25.00%<br />
20.00%<br />
15.00%<br />
21.21%<br />
18.27%<br />
18.91%<br />
25.36%<br />
20.59%<br />
19.63%<br />
30.53%<br />
22.24%<br />
21.04%<br />
33.27%<br />
25.87%<br />
20.26%<br />
32.02%<br />
25.22%<br />
19.17%<br />
27.87%<br />
22.83%<br />
19.75%<br />
30.49%<br />
23.39%<br />
17.13%<br />
80%<br />
10.00%<br />
75%<br />
70%<br />
3,639<br />
4,445<br />
4,937<br />
6,103<br />
6,932 7,133<br />
7,348<br />
7,660<br />
8,925<br />
11,521<br />
FY1997 FY1998 FY1999 FY2000 FY2001 FY2002 FY2003 FY2004 FY<strong>2005</strong> FY20<strong>06</strong><br />
5.00%<br />
Material Consumed Manufacturing Expenses Personnel Expenses Administrative Expenses<br />
0.00%<br />
FY2000 FY2001 FY2002 FY2003 FY2004 FY<strong>2005</strong> FY20<strong>06</strong><br />
Financial Expenses Depreciation Selling Expenses<br />
Return of Net Worth (RONW) Return on Capital Employed (ROCE) Return Capital Invested (ROIC)<br />
56 Winning Momentum 57