Annual Report - 2005-06 - GAIL (India)
Annual Report - 2005-06 - GAIL (India)
Annual Report - 2005-06 - GAIL (India)

You also want an ePaper? Increase the reach of your titles
YUMPU automatically turns print PDFs into web optimized ePapers that Google loves.
Your Company has been earning a<br />
consistently high rate of return over the<br />
past seven years as depicted above. The<br />
returns earned by your Company have<br />
been mainly in the high 20% region in the<br />
past 7 years representing your Company’s<br />
financial health.<br />
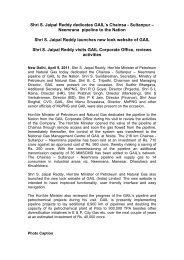
SHAREHOLDERS’ FUND<br />
This has resulted in building up of over<br />
5 times the reserves and surplus in the<br />
past 10 years. However at the same<br />
time your Company has maintained<br />
consistent growth in the dividend<br />
payout ratio.<br />
16,080<br />
Your Company has not only retained sufficient<br />
amounts for its future projects but has also made a<br />
sincere attempt to remunerate the shareholders.<br />
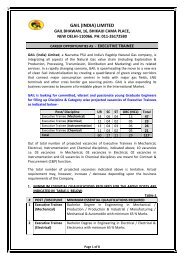
FIXED ASSETS<br />
Break-up of Fixed Assets (Gross Block)<br />
30<br />
EPS and Book Value per Share<br />
140<br />
14,080<br />
1096<br />
1158 1191<br />
EPS in Rs.<br />
25<br />
20<br />
15<br />
10<br />
5<br />
10 Year CAGR<br />
EPS 16%<br />
Book Value per share 17%<br />
48.91<br />
40.25<br />
30.38<br />
12.07 12.53<br />
7.33<br />
55.76<br />
10.18<br />
64.67 63.<strong>06</strong><br />
13.32<br />
14.02<br />
74.93<br />
19.38<br />
87.63<br />
22.11<br />
101.22<br />
23.11<br />
116.77<br />
27.32<br />
120<br />
100<br />
80<br />
60<br />
40<br />
20<br />
Book value in Rs.<br />
in Rs. Crores<br />
12,080<br />
10,080<br />
8,080<br />
6,080<br />
4,080<br />
80<br />
1028<br />
976<br />
900<br />
718<br />
585<br />
13,<strong>06</strong>4<br />
12,489<br />
13,278<br />
436<br />
9,726 10,021<br />
9,137<br />
7,804<br />
294<br />
7,183<br />
4,746<br />
3,633<br />
FY1997 FY1998 FY1998 FY2000 FY2001 FY2002 FY2003 FY2004 FY<strong>2005</strong> FY20<strong>06</strong><br />
0<br />
FY1997 FY1998 FY1999 FY2000 FY2001 FY2002 FY2003 FY2004 FY<strong>2005</strong> FY20<strong>06</strong><br />
0<br />
Plant and Machinery<br />
Other Assets<br />
EPS<br />
Book Value per share<br />
The EPS of your Company has risen at a CAGR of 16% and your Company has driven the Book Value per share<br />
at a CAGR of 17% over the last 10 years.<br />
Your Company has invested more in value adding<br />
assets such as Plant and Machinery than other<br />
assets such as land, building, furniture etc. As on<br />
date the proportion of plant and machinery is more<br />
than 90% of the total asset base.<br />
No of Times<br />
0.90<br />
0.80<br />
0.70<br />
0.50<br />
0.40<br />
0.77<br />
0.82<br />
0.69<br />
Share Holders Funds<br />
0.67 0.67<br />
0.68<br />
4634 4490<br />
0.39<br />
0.61<br />
5493<br />
0.41<br />
0.59<br />
6600<br />
0.39<br />
7780<br />
0.61<br />
0.42<br />
9128<br />
0.58<br />
10000<br />
9000<br />
8000<br />
7000<br />
6000<br />
5000<br />
Reserves and Surplus in Rs. Crores<br />
Some of the other ratios with respect to the Fixed<br />
Asset and Depreciation are as follows:<br />
Particulars <strong>2005</strong>-20<strong>06</strong> 2004-<strong>2005</strong><br />
Depreciation as % of Gross Block 4% 7%<br />
Accumulated Depreciation as % of Gross Block 48% 45%<br />
Net Fixed Assets Turnover (net of ED) Ratio 1.91 1.58<br />
0.30<br />
3300<br />
3880<br />
0.33<br />
0.32<br />
4000<br />
0.20<br />
0.23<br />
1734<br />
0.18<br />
2568<br />
0.31<br />
0.33<br />
3000<br />
2000<br />
0.10<br />
FY1997 FY1998 FY1999 FY2000 FY2001 FY2002 FY2003 FY2004 FY<strong>2005</strong> FY20<strong>06</strong><br />
Dividend Payout Ratio Retention Ratio Reserves and Surplus<br />
1000<br />
58 Winning Momentum 59