Annual Report - 2005-06 - GAIL (India)
Annual Report - 2005-06 - GAIL (India)
Annual Report - 2005-06 - GAIL (India)

Create successful ePaper yourself
Turn your PDF publications into a flip-book with our unique Google optimized e-Paper software.
SUNDRY DEBTORS<br />
The debtors (net of provision) of your<br />
Company as on 31 st March, 20<strong>06</strong> stood at<br />
Rs.753.47 Crores.<br />
Particulars <strong>2005</strong>-20<strong>06</strong> 2004-<strong>2005</strong> Change<br />
Sundry Debtors (Rs in Crores) 753.47 822.86 (8%)<br />
Debtors collection period 20 days 23 days 3 days<br />
Debtors as a % of Turnover (net of ED) 5% 7% -<br />
There has been a marginal decrease in<br />
debtors outstanding as compared to the<br />
previous year. The collection period from<br />
debtors has also reduced by 3 days.<br />
CASH AND BANK BALANCES<br />
The growth of your Company has been<br />
largely financed through cash generated<br />
from operations and to a lesser extent<br />
from external proceeds. Your Company’s<br />
cash and bank balances as at the end<br />
of <strong>2005</strong>-20<strong>06</strong> were Rs.4496 Crores as<br />
against Rs.3447 Crores in 2004-<strong>2005</strong> which<br />
represents a 30% increase. Your Company<br />
has maintained higher cash and bank balances<br />
in order to meet the future CAPEX plans. Your<br />
Company’s treasury policy calls for investing the<br />
surplus funds with the highly rated banks for short<br />
term maturities. Your Company has earned Interest<br />
on Deposits with banks of Rs.221 Crores which has<br />
increased by 100% as compared to the previous<br />
year figure of Rs.100.5 Crores. Investments made by<br />
your Company are through the e-investment mode<br />
which is quick and transparent.<br />
Particulars <strong>2005</strong>-<strong>06</strong> 2004-05<br />
Cash and cash equivalents as % of total assets 27% 22%<br />
Cash and cash equivalents as % of revenue 31% 28%<br />
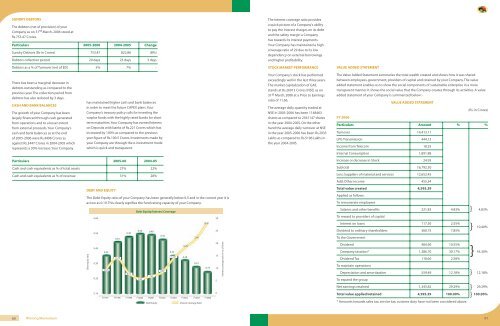
DEBT AND EQUITY<br />
The Debt-Equity ratio of your Company has been generally below 0.5 and in the current year it is<br />
as low as 0.19. This clearly signifies the fund raising capacity of your Company.<br />
Debt equity ratio<br />
0.60<br />
0.50<br />
0.40<br />
0.30<br />
0.20<br />
0.10<br />
0.32<br />
10.25<br />
0.43<br />
14.73<br />
0.48<br />
8.51<br />
Debt Equity/Interest Coverage<br />
0.50 0.49<br />
6.25<br />
7.25<br />
FY1997 FY1998 FY1999 FY2000 FY2001 FY2002 FY2003 FY2004 FY<strong>2005</strong> FY20<strong>06</strong><br />
Debt Equity<br />
0.45<br />
8.90<br />
0.32<br />
14.51<br />
18.77<br />
0.29<br />
22.41<br />
0.23<br />
Interest Coverage Ratio<br />
28.91<br />
0.19<br />
30<br />
25<br />
20<br />
15<br />
10<br />
5<br />
0<br />
Interest coverage ratio in no. of times<br />
The interest coverage ratio provides<br />
a quick picture of a Company’s ability<br />
to pay the interest charges on its debt<br />
and the safety margin a Company<br />
has towards its interest payments.<br />
Your Company has maintained a high<br />
coverage ratio of 29 due to its low<br />
dependency on external borrowings<br />
and higher profitability.<br />
STOCK MARKET PERFORMANCE<br />
Your Company’s stock has performed<br />
exceedingly well in the last three years.<br />
The market capitalization of <strong>GAIL</strong><br />
stands at Rs.26913 Crores (NSE) as on<br />
31st March, 20<strong>06</strong> at a Price to Earnings<br />
ratio of 11.66.<br />
The average daily quantity traded at<br />
NSE in <strong>2005</strong>-20<strong>06</strong> has been 1148463<br />
shares as compared to 2561147 shares<br />
in the year 2004-<strong>2005</strong>. On the other<br />
hand the average daily turnover at NSE<br />
in the year <strong>2005</strong>-20<strong>06</strong> has been Rs.2933<br />
Lakhs as compared to Rs.5196 Lakhs in<br />
the year 2004-<strong>2005</strong>.<br />
VALUE ADDED STATEMENT<br />
The Value Added Statement summaries the total wealth created and shows how it was shared<br />
between employees, government, providers of capital and retained by your Company. The value<br />
added statement enables us to show the social components of sustainable enterprise in a more<br />
transparent manner. It shows the social value that the Company creates through its activities. A value<br />
added statement of your Company is summarized below: -<br />
FY 20<strong>06</strong><br />
VALUE ADDED STATEMENT<br />
(Rs. in Crores)<br />
Particulars Amount % %<br />
Turnover 14,413.11<br />
LPG Transmission 444.13<br />
Income from Telecom 18.25<br />
Internal Consumption 1,891.88<br />
Increase or decrease in Stock 24.93<br />
Subtotal 16,792.30<br />
Less: Suppliers of material and services 12,652.45<br />
Add: Other income 455.54<br />
Total value created 4,595.39<br />
Applied as follows:<br />
To remunerate employees<br />
Salaries and other benefits 221.83 4.83% 4.83%<br />
To reward to providers of capital<br />
Interest on loans 117.30 2.55%<br />
Dividend to ordinary shareholders 360.75 7.85%<br />
10.40%<br />
To the Government<br />
Dividend 484.90 10.55%<br />
}<br />
Company taxation* 1,386.70 30.17% 43.30%<br />
Dividend Tax 118.60 2.58%<br />
To maintain operations<br />
Depreciation and amortization 559.49 12.18% 12.18%<br />
To expand the group<br />
Net earnings retained 1,345.82 29.29% 29.29%<br />
Total value applied/retained 4,595.39 100.00% 100.00%<br />
* Amounts towards sales tax, service tax, customs duty have not been considered above.<br />
}<br />
}<br />
}<br />
}<br />
}<br />
60 Winning Momentum 61