Annual Report - 2005-06 - GAIL (India)
Annual Report - 2005-06 - GAIL (India)
Annual Report - 2005-06 - GAIL (India)

You also want an ePaper? Increase the reach of your titles
YUMPU automatically turns print PDFs into web optimized ePapers that Google loves.
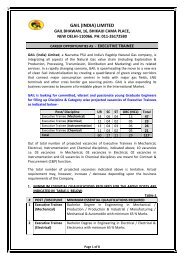
4. SOURCES AND USES OF FUNDS<br />
Funds amounting to Rs.2908.97 Crores were generated from internal and external sources and utilised during the year <strong>2005</strong>-20<strong>06</strong> as follows :<br />
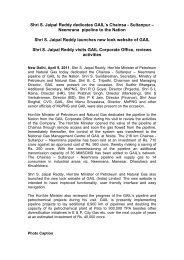
6. SUNDRY DEBTORS<br />
(i) The percentage of Sundry Debtors to Sales during the last three years is given below :<br />
Sources of Funds<br />
Funds from operations<br />
Profit after Tax 2310.07<br />
Add:Loss on Sale of Fixed Assets(net) 2.14<br />
2312.21<br />
Add : Depreciation/write off 549.76<br />
Add : Deferred Tax liability provided for 44.47<br />
29<strong>06</strong>.44<br />
Less : Capital Reserve write off 0.11<br />
Less : Foreign Currency Translation Reserve (1.47)<br />
(Rs. in Crores)<br />
<strong>2005</strong>-<strong>06</strong><br />
2907.80<br />
(Rs. in Crores)<br />
As on Considered Considered Total Sales Percentage of Sundry<br />
31st March Good Doubtful Debtors Debtors to Sales<br />
2004 720.69 125.25 845.94 11295.67 7.49<br />
<strong>2005</strong> 822.86 120.25 943.11 12927.07 7.30<br />
20<strong>06</strong> 753.47 120.29 873.76 14875.49 5.87<br />
The Sundry Debtors represents 0.70 months sales in <strong>2005</strong>-20<strong>06</strong> as compared to 0.88 months sales in 2004-<strong>2005</strong> and 0.90 months sales in 2003-04.<br />
(ii) Period - wise Sundry Debtors as on 31.3.20<strong>06</strong> are given below :<br />
Debts Outstanding<br />
(Rs. in Crores)<br />
Govt. Depts. Govt. Companies Private Parties Total<br />
(I) Upto one year 6.68 333.78 321.64 662.10<br />
Sale of Fixed Assets 1.17<br />
Total 2908.97<br />
Utilisation of Funds<br />
Increase in Fixed Assets 263.15<br />
Add : Increase in Capital Work-in-Progress 3<strong>06</strong>.51 569.66<br />
Decrease in Borrowed funds 80.84<br />
Increase in Investments 659.40<br />
Increase in Working Capital 441.97<br />
Dividend Paid incl. Dividend Tax 1157.10<br />
Total 2908.97<br />
(ii) More than 1 year but less than 2 years 0.00 12.80 0.31 13.11<br />
(iii) 2 Years or more but less than 3 years 0.00 13.20 0.26 13.46<br />
(iv) 3 years or more 0.00 64.95 120.14 185.09<br />
a) The dues from Government, Government Companies and Private parties constitute 0.76%, 48.61% and 50.63% of the total Sundry Debtors<br />
respectively.<br />
b) The dues outstanding for more than 3 years increased from 16.35% during 2004-05 to 21.18% of the total Sundry Debtors in the year <strong>2005</strong>-<strong>06</strong>.<br />
Place: New Delhi<br />
Dated: 20.<strong>06</strong>.20<strong>06</strong><br />
(A. K. SINGH)<br />
PRINCIPAL DIRECTOR OF COMMERCIAL AUDIT<br />
& EX-OFFICIO MEMBER, AUDIT BOARD-II<br />
5. INVENTORY LEVELS<br />
The inventory levels at the end of the last three years are given below :<br />
(Rs. in Crores)<br />
2003-04 2004-05 <strong>2005</strong>-<strong>06</strong><br />
Stores and Spares 343.46 376.85 353.67<br />
Stock of Gas/LPG/Polymers & other Products 131.45 104.59 129.52<br />
134 Winning Momentum 135