Read More - Philippine Institute for Development Studies
Read More - Philippine Institute for Development Studies
Read More - Philippine Institute for Development Studies

Create successful ePaper yourself
Turn your PDF publications into a flip-book with our unique Google optimized e-Paper software.
Communicating through climate indicator<br />
signs<br />
17<br />
Bronya Alexander<br />
and Peter Hayman<br />
Motorists are often<br />
exposed to<br />
in<strong>for</strong>mative road<br />
signs such as bushfire risk or<br />
number of road accidents. So why<br />
not have a sign to convey seasonal<br />
climate in<strong>for</strong>mation Based on an<br />
idea from the Birchip cropping<br />
group in Victoria, along with<br />
funding from the South Australian<br />
Grains Industry Trust Fund and<br />
other organizations, the South<br />
Australia Research and<br />
<strong>Development</strong> <strong>Institute</strong> (SARDI) has developed the Climate<br />
Indicator signs. These large signs are used to convey a<br />
range of different types of seasonal climate in<strong>for</strong>mation<br />
through the use of colored dials. They are placed in<br />
paddocks on the road side so that farmers and<br />
agriculturists can see the latest in<strong>for</strong>mation and outlooks.<br />
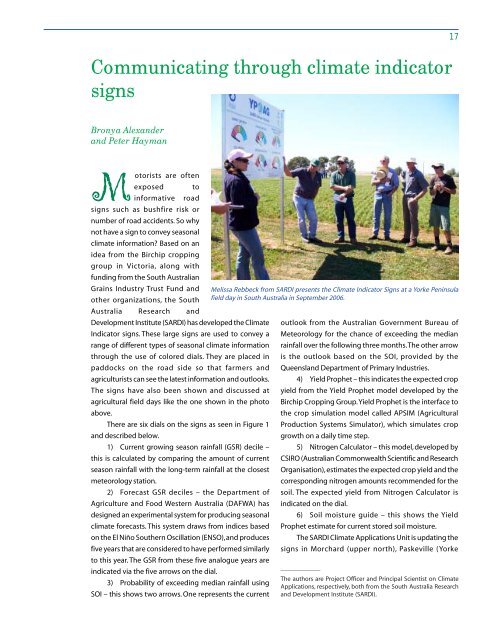
The signs have also been shown and discussed at<br />
agricultural field days like the one shown in the photo<br />
above.<br />
There are six dials on the signs as seen in Figure 1<br />
and described below.<br />
1) Current growing season rainfall (GSR) decile –<br />
this is calculated by comparing the amount of current<br />
season rainfall with the long-term rainfall at the closest<br />
meteorology station.<br />
2) Forecast GSR deciles – the Department of<br />
Agriculture and Food Western Australia (DAFWA) has<br />
designed an experimental system <strong>for</strong> producing seasonal<br />
climate <strong>for</strong>ecasts. This system draws from indices based<br />
on the El Niño Southern Oscillation (ENSO), and produces<br />
five years that are considered to have per<strong>for</strong>med similarly<br />
to this year. The GSR from these five analogue years are<br />
indicated via the five arrows on the dial.<br />
3) Probability of exceeding median rainfall using<br />
SOI – this shows two arrows. One represents the current<br />
Melissa Rebbeck from SARDI presents the Climate Indicator Signs at a Yorke Peninsula<br />
field day in South Australia in September 2006.<br />
outlook from the Australian Government Bureau of<br />
Meteorology <strong>for</strong> the chance of exceeding the median<br />
rainfall over the following three months. The other arrow<br />
is the outlook based on the SOI, provided by the<br />
Queensland Department of Primary Industries.<br />
4) Yield Prophet – this indicates the expected crop<br />
yield from the Yield Prophet model developed by the<br />
Birchip Cropping Group. Yield Prophet is the interface to<br />
the crop simulation model called APSIM (Agricultural<br />
Production Systems Simulator), which simulates crop<br />
growth on a daily time step.<br />
5) Nitrogen Calculator – this model, developed by<br />
CSIRO (Australian Commonwealth Scientific and Research<br />
Organisation), estimates the expected crop yield and the<br />
corresponding nitrogen amounts recommended <strong>for</strong> the<br />
soil. The expected yield from Nitrogen Calculator is<br />
indicated on the dial.<br />
6) Soil moisture guide – this shows the Yield<br />
Prophet estimate <strong>for</strong> current stored soil moisture.<br />
The SARDI Climate Applications Unit is updating the<br />
signs in Morchard (upper north), Paskeville (Yorke<br />
____________<br />
The authors are Project Officer and Principal Scientist on Climate<br />
Applications, respectively, both from the South Australia Research<br />
and <strong>Development</strong> <strong>Institute</strong> (SARDI).