Read More - Philippine Institute for Development Studies
Read More - Philippine Institute for Development Studies
Read More - Philippine Institute for Development Studies

You also want an ePaper? Increase the reach of your titles
YUMPU automatically turns print PDFs into web optimized ePapers that Google loves.
60 SCF Folio<br />
...The notion that probabilistic <strong>for</strong>ecasts cannot be used in<br />
decisionmaking is not true. Notwithstanding difficulties in<br />
communication, a <strong>for</strong>ecast should be presented as a<br />
probability because it is the honest way of doing it...The<br />
challenge is how to communicate and use in decisionmaking<br />
skillful but uncertain <strong>for</strong>ecasts that are best represented as<br />
shifts in climatological probability distributions.<br />
excessive rains rather than to a more qualified<br />
statement of increased chances of the events occurring.<br />
Implied in these inclinations is the notion that<br />
probabilistic <strong>for</strong>ecasts cannot be used in<br />
decisionmaking. This notion, however, needs to be<br />
corrected because it is not true. Notwithstanding<br />
difficulties in communication, a <strong>for</strong>ecast should be<br />
presented as a probability because it is the honest way<br />
of doing it. As an expert puts it, the atmosphere is a<br />
complex chaotic fluid, and although patterns of ocean<br />
temperatures ‘nudge’ this chaos in certain directions,<br />
there will always be a significant proportion of<br />
unexplained variation. Hence, the challenge is how to<br />
communicate and use in decisionmaking skillful but<br />
uncertain <strong>for</strong>ecasts that are best represented as shifts<br />
in climatological probability distributions.<br />
Probabilistic <strong>for</strong>ecasts also ensure that risk<br />
management is not hindered. A farmer who<br />
misunderstands SCF as a categorical <strong>for</strong>ecast may be<br />
led to devise poorer risk management strategies<br />
compared to a situation where he did not hear of the<br />
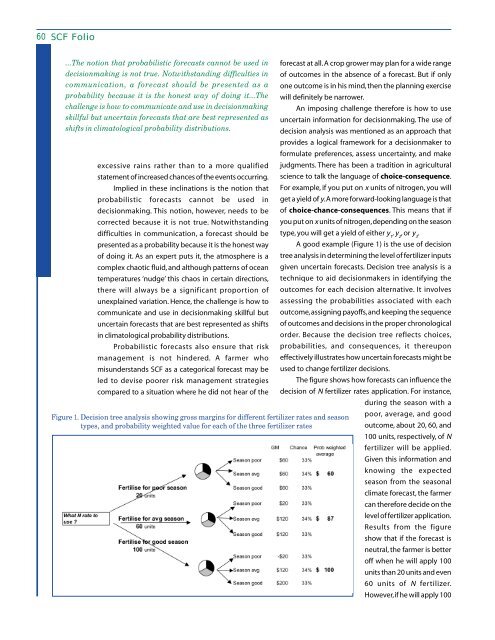
Figure 1. Decision tree analysis showing gross margins <strong>for</strong> different fertilizer rates and season<br />
types, and probability weighted value <strong>for</strong> each of the three fertilizer rates<br />
<strong>for</strong>ecast at all. A crop grower may plan <strong>for</strong> a wide range<br />
of outcomes in the absence of a <strong>for</strong>ecast. But if only<br />
one outcome is in his mind, then the planning exercise<br />
will definitely be narrower.<br />
An imposing challenge there<strong>for</strong>e is how to use<br />
uncertain in<strong>for</strong>mation <strong>for</strong> decisionmaking. The use of<br />
decision analysis was mentioned as an approach that<br />
provides a logical framework <strong>for</strong> a decisionmaker to<br />
<strong>for</strong>mulate preferences, assess uncertainty, and make<br />
judgments. There has been a tradition in agricultural<br />
science to talk the language of choice-consequence.<br />
For example, if you put on x units of nitrogen, you will<br />
get a yield of y. A more <strong>for</strong>ward-looking language is that<br />
of choice-chance-consequences. This means that if<br />
you put on x units of nitrogen, depending on the season<br />
type, you will get a yield of either y 1<br />
, y 2<br />
, or y 3<br />
.<br />
A good example (Figure 1) is the use of decision<br />
tree analysis in determining the level of fertilizer inputs<br />
given uncertain <strong>for</strong>ecasts. Decision tree analysis is a<br />
technique to aid decisionmakers in identifying the<br />
outcomes <strong>for</strong> each decision alternative. It involves<br />
assessing the probabilities associated with each<br />
outcome, assigning payoffs, and keeping the sequence<br />
of outcomes and decisions in the proper chronological<br />
order. Because the decision tree reflects choices,<br />
probabilities, and consequences, it thereupon<br />
effectively illustrates how uncertain <strong>for</strong>ecasts might be<br />
used to change fertilizer decisions.<br />
The figure shows how <strong>for</strong>ecasts can influence the<br />
decision of N fertilizer rates application. For instance,<br />
during the season with a<br />
poor, average, and good<br />
outcome, about 20, 60, and<br />
100 units, respectively, of N<br />
fertilizer will be applied.<br />
Given this in<strong>for</strong>mation and<br />
knowing the expected<br />
season from the seasonal<br />
climate <strong>for</strong>ecast, the farmer<br />
can there<strong>for</strong>e decide on the<br />
level of fertilizer application.<br />
Results from the figure<br />
show that if the <strong>for</strong>ecast is<br />
neutral, the farmer is better<br />
off when he will apply 100<br />
units than 20 units and even<br />
60 units of N fertilizer.<br />
However, if he will apply 100