Where am I? Sensors and Methods for Mobile Robot Positioning
Where am I? Sensors and Methods for Mobile Robot Positioning
Where am I? Sensors and Methods for Mobile Robot Positioning

You also want an ePaper? Increase the reach of your titles
YUMPU automatically turns print PDFs into web optimized ePapers that Google loves.
192 Part II Systems <strong>and</strong> <strong>Methods</strong> <strong>for</strong> <strong>Mobile</strong> <strong>Robot</strong> <strong>Positioning</strong><br />
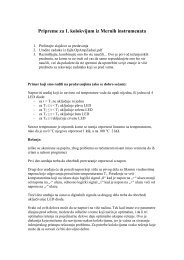
Experiments show that this approach is<br />
highly stable against noise, <strong>and</strong> even moving<br />
obstacles do not distort the result as long as<br />
they do not represent the majority of matchable<br />
data. Figure 8.7a shows two scans<br />
taken from two different locations. The<br />
second scan represents a rotation of +43<br />
degrees, a translation in x-direction of +14<br />
centimeters <strong>and</strong> a translation in y-direction<br />
of +96 centimeters. Figure 8.7b shows the<br />
angle histogr<strong>am</strong> associated with the two<br />
positions. The maxima <strong>for</strong> the main directions<br />
are -24 <strong>and</strong> 19 degrees, respectively.<br />
Definition<br />
A cross-correlation is defined as<br />
X<br />
1<br />
c(y) ' lim f(x)g(x%y)dx .<br />
X64 2X m<br />
&X<br />
(8.3)<br />
c(y) is a measure of the cross-correlation between two<br />
stochastic functions regarding the phase shift y. The<br />
cross-correlation c(y) will have an absolute maximum at s, if<br />
f(x) is equal to g(x+s). (Courtesy of [Weiß et al., 1994].)<br />
These angles correspond to the rotation of the robot relative to the local main direction. One can thus<br />
conclude that the rotational displacement of the robot was 19E -(-24E) = +43E. Furthermore, rotation<br />
of the first <strong>and</strong> second range plot by -24 <strong>and</strong> 19 degrees, respectively, provides the normalized x- <strong>and</strong><br />
y-plots shown in Fig 8.7c. The cross correlation of the x translation is shown in Figure 8.7d. The<br />
maximum occurs at -35 centimeters, which corresponds to -14 centimeters in the rotated scan (Fig.<br />
8.7a). Similarly, the y-translation can be found to be +98 centimeters in the rotated scan. Figure 8.5e<br />
shows the result of scan matching after making all rotational <strong>and</strong> translational corrections.<br />
Figure 8.7: Various stages during the matching of two angle histogr<strong>am</strong>s. The two histogr<strong>am</strong>s were built<br />
from scan data taken from two different locations. (Courtesy of [Weiß et al., 1994].)<br />
o<br />
a. Two scans with rotation of +43 , x-transition of +14 cm, y-transition of +96 cm.<br />
b. Angle histogr<strong>am</strong> of the two positions.<br />
o o<br />
c. Scans rotated according to the maximum of their angle histogr<strong>am</strong> (+24 , -19 ).<br />
d. Cross-correlation of the x-translation (maximum at -35 cm, corresponding to -14 cm in the rotated scan).<br />
e. x-translation correction of +14 cm; y-translation correction of -98 cm.