A Step by Step Guide for SPSS and Exercise Studies
A Step by Step Guide for SPSS and Exercise Studies
A Step by Step Guide for SPSS and Exercise Studies

Create successful ePaper yourself
Turn your PDF publications into a flip-book with our unique Google optimized e-Paper software.
150 Statistical tests<br />
Nonparametric Tests/Chi-square<br />
This test is employed to compare two or more categories of one or more variables.<br />
For example, you may want to examine whether a sample of 100 pupils differ in<br />
their choice of favourite football club. After carrying out a frequency count, you<br />
find out that 32 pupils support club A, 26 support club B, 19 support club C, 14<br />
support club D, <strong>and</strong> 9 support club E. In the data file you can create a variable<br />
with 100 cases (rows) that will represent the club preference of each pupil.<br />
Alternatively, you can create another variable (clubs) with five rows. Type in the<br />
total number of preferences <strong>for</strong> each of the five clubs, <strong>and</strong> then use the weight<br />
cases option of the Data menu to indicate that each row represents a total score<br />
rather than an individual case (Figure 45).<br />
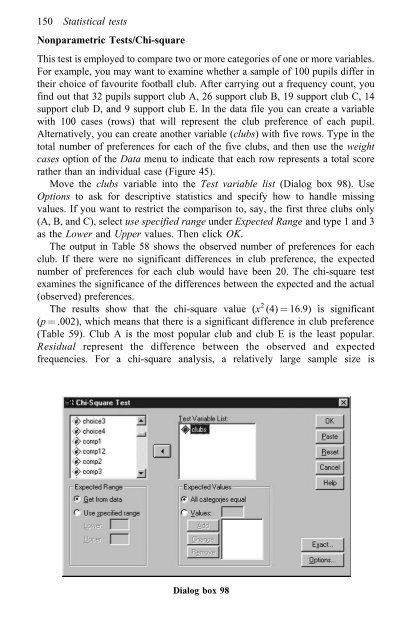
Move the clubs variable into the Test variable list (Dialog box 98). Use<br />
Options to ask <strong>for</strong> descriptive statistics <strong>and</strong> specify how to h<strong>and</strong>le missing<br />
values. If you want to restrict the comparison to, say, the first three clubs only<br />
(A, B, <strong>and</strong> C), select use specified range under Expected Range <strong>and</strong> type 1 <strong>and</strong> 3<br />
as the Lower <strong>and</strong> Upper values. Then click OK.<br />
The output in Table 58 shows the observed number of preferences <strong>for</strong> each<br />
club. If there were no significant differences in club preference, the expected<br />
number of preferences <strong>for</strong> each club would have been 20. The chi-square test<br />
examines the significance of the differences between the expected <strong>and</strong> the actual<br />
(observed) preferences.<br />
The results show that the chi-square value (x 2 (4) ˆ 16.9) is significant<br />
(p ˆ .002), which means that there is a significant difference in club preference<br />
(Table 59). Club A is the most popular club <strong>and</strong> club E is the least popular.<br />
Residual represent the difference between the observed <strong>and</strong> expected<br />
frequencies. For a chi-square analysis, a relatively large sample size is<br />
Dialog box 98