A Step by Step Guide for SPSS and Exercise Studies
A Step by Step Guide for SPSS and Exercise Studies
A Step by Step Guide for SPSS and Exercise Studies

You also want an ePaper? Increase the reach of your titles
YUMPU automatically turns print PDFs into web optimized ePapers that Google loves.
Statistical tests 47<br />
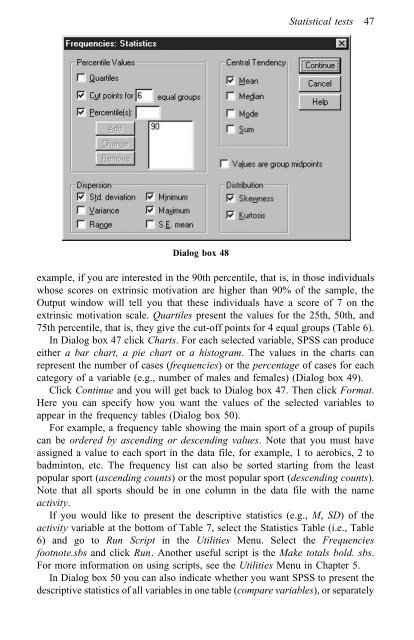
Dialog box 48<br />
example, if you are interested in the 90th percentile, that is, in those individuals<br />
whose scores on extrinsic motivation are higher than 90% of the sample, the<br />
Output window will tell you that these individuals have a score of 7 on the<br />
extrinsic motivation scale. Quartiles present the values <strong>for</strong> the 25th, 50th, <strong>and</strong><br />
75th percentile, that is, they give the cut-off points <strong>for</strong> 4 equal groups (Table 6).<br />
In Dialog box 47 click Charts. For each selected variable, <strong>SPSS</strong> can produce<br />
either a bar chart, a pie chart or a histogram. The values in the charts can<br />
represent the number of cases (frequencies) or the percentage of cases <strong>for</strong> each<br />
category of a variable (e.g., number of males <strong>and</strong> females) (Dialog box 49).<br />
Click Continue <strong>and</strong> you will get back to Dialog box 47. Then click Format.<br />
Here you can specify how you want the values of the selected variables to<br />
appear in the frequency tables (Dialog box 50).<br />
For example, a frequency table showing the main sport of a group of pupils<br />
can be ordered <strong>by</strong> ascending or descending values. Note that you must have<br />
assigned a value to each sport in the data file, <strong>for</strong> example, 1 to aerobics, 2 to<br />
badminton, etc. The frequency list can also be sorted starting from the least<br />
popular sport (ascending counts) or the most popular sport (descending counts).<br />
Note that all sports should be in one column in the data file with the name<br />
activity.<br />
If you would like to present the descriptive statistics (e.g., M, SD) of the<br />
activity variable at the bottom of Table 7, select the Statistics Table (i.e., Table<br />
6) <strong>and</strong> go to Run Script in the Utilities Menu. Select the Frequencies<br />
footnote.sbs <strong>and</strong> click Run. Another useful script is the Make totals bold. sbs.<br />
For more in<strong>for</strong>mation on using scripts, see the Utilities Menu in Chapter 5.<br />
In Dialog box 50 you can also indicate whether you want <strong>SPSS</strong> to present the<br />
descriptive statistics of all variables in one table (compare variables), or separately