A Step by Step Guide for SPSS and Exercise Studies
A Step by Step Guide for SPSS and Exercise Studies
A Step by Step Guide for SPSS and Exercise Studies

You also want an ePaper? Increase the reach of your titles
YUMPU automatically turns print PDFs into web optimized ePapers that Google loves.
66 Statistical tests<br />
How to carry out the test<br />
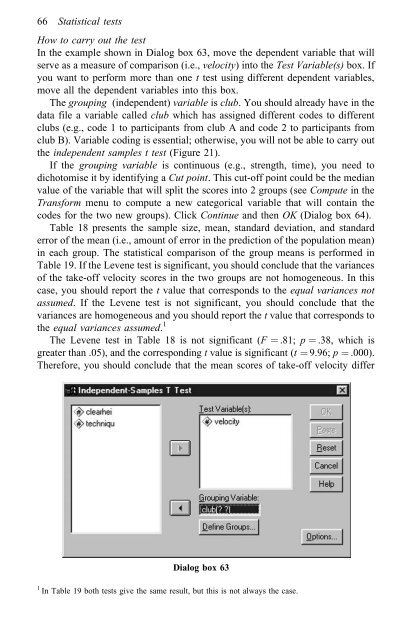
In the example shown in Dialog box 63, move the dependent variable that will<br />
serve as a measure of comparison (i.e., velocity) into the Test Variable(s) box. If<br />
you want to per<strong>for</strong>m more than one t test using different dependent variables,<br />
move all the dependent variables into this box.<br />
The grouping (independent) variable is club. You should already have in the<br />
data file a variable called club which has assigned different codes to different<br />
clubs (e.g., code 1 to participants from club A <strong>and</strong> code 2 to participants from<br />
club B). Variable coding is essential; otherwise, you will not be able to carry out<br />
the independent samples t test (Figure 21).<br />
If the grouping variable is continuous (e.g., strength, time), you need to<br />
dichotomise it <strong>by</strong> identifying a Cut point. This cut-off point could be the median<br />
value of the variable that will split the scores into 2 groups (see Compute in the<br />
Trans<strong>for</strong>m menu to compute a new categorical variable that will contain the<br />
codes <strong>for</strong> the two new groups). Click Continue <strong>and</strong> then OK (Dialog box 64).<br />
Table 18 presents the sample size, mean, st<strong>and</strong>ard deviation, <strong>and</strong> st<strong>and</strong>ard<br />
error of the mean (i.e., amount of error in the prediction of the population mean)<br />
in each group. The statistical comparison of the group means is per<strong>for</strong>med in<br />
Table 19. If the Levene test is significant, you should conclude that the variances<br />
of the take-off velocity scores in the two groups are not homogeneous. In this<br />
case, you should report the t value that corresponds to the equal variances not<br />
assumed. If the Levene test is not significant, you should conclude that the<br />
variances are homogeneous <strong>and</strong> you should report the t value that corresponds to<br />
the equal variances assumed. 1<br />
The Levene test in Table 18 is not significant (F ˆ .81; p ˆ .38, which is<br />
greater than .05), <strong>and</strong> the corresponding t value is significant (t ˆ 9.96; p ˆ .000).<br />
There<strong>for</strong>e, you should conclude that the mean scores of take-off velocity differ<br />
Dialog box 63<br />
1 In Table 19 both tests give the same result, but this is not always the case.