Tesco plc Annual Report and Financial Statements 2012
Tesco plc Annual Report and Financial Statements 2012
Tesco plc Annual Report and Financial Statements 2012

Create successful ePaper yourself
Turn your PDF publications into a flip-book with our unique Google optimized e-Paper software.
OVERVIEW<br />
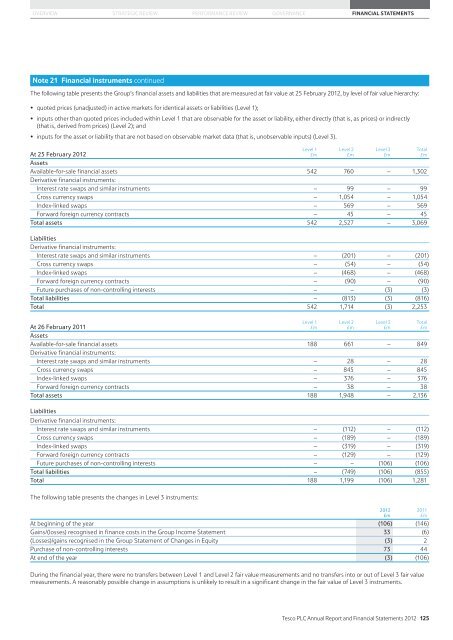
Note 21 <strong>Financial</strong> instruments continued<br />
STRATEGIC REVIEW PERFORMANCE REVIEW GOVERNANCE FINANCIAL STATEMENTS<br />
The following table presents the Group’s financial assets <strong>and</strong> liabilities that are measured at fair value at 25 February <strong>2012</strong>, by level of fair value hierarchy:<br />
�� quoted prices (unadjusted) in active markets for identical assets or liabilities (Level 1);<br />
�� inputs other than quoted prices included within Level 1 that are observable for the asset or liability, either directly (that is, as prices) or indirectly<br />
(that is, derived from prices) (Level 2); <strong>and</strong><br />
�� inputs for the asset or liability that are not based on observable market data (that is, unobservable inputs) (Level 3).<br />
At 25 February <strong>2012</strong><br />
Assets<br />
Available-for-sale financial assets 542 760 – 1,302<br />
Derivative financial instruments:<br />
Interest rate swaps <strong>and</strong> similar instruments – 99 – 99<br />
Cross currency swaps – 1,054 – 1,054<br />
Index-linked swaps – 569 – 569<br />
Forward foreign currency contracts – 45 – 45<br />
Total assets 542 2,527 – 3,069<br />
Liabilities<br />
Derivative financial instruments:<br />
Interest rate swaps <strong>and</strong> similar instruments – (201) – (201)<br />
Cross currency swaps – (54) – (54)<br />
Index-linked swaps – (468) – (468)<br />
Forward foreign currency contracts – (90) – (90)<br />
Future purchases of non-controlling interests – – (3) (3)<br />
Total liabilities – (813) (3) (816)<br />
Total 542 1,714 (3) 2,253<br />
At 26 February 2011<br />
Assets<br />
Available-for-sale financial assets 188 661 – 849<br />
Derivative financial instruments:<br />
Interest rate swaps <strong>and</strong> similar instruments – 28 – 28<br />
Cross currency swaps – 845 – 845<br />
Index-linked swaps – 376 – 376<br />
Forward foreign currency contracts – 38 – 38<br />
Total assets 188 1,948 – 2,136<br />
Liabilities<br />
Derivative financial instruments:<br />
Interest rate swaps <strong>and</strong> similar instruments – (112) – (112)<br />
Cross currency swaps – (189) – (189)<br />
Index-linked swaps – (319) – (319)<br />
Forward foreign currency contracts – (129) – (129)<br />
Future purchases of non-controlling interests – – (106) (106)<br />
Total liabilities – (749) (106) (855)<br />
Total 188 1,199 (106) 1,281<br />
The following table presents the changes in Level 3 instruments:<br />
At beginning of the year (106) (146)<br />
Gains/(losses) recognised in finance costs in the Group Income Statement 33 (6)<br />
(Losses)/gains recognised in the Group Statement of Changes in Equity (3) 2<br />
Purchase of non-controlling interests 73 44<br />
At end of the year (3) (106)<br />
During the financial year, there were no transfers between Level 1 <strong>and</strong> Level 2 fair value measurements <strong>and</strong> no transfers into or out of Level 3 fair value<br />
measurements. A reasonably possible change in assumptions is unlikely to result in a significant change in the fair value of Level 3 instruments.<br />
Level 1<br />
£m<br />
Level 1<br />
£m<br />
Level 2<br />
£m<br />
Level 2<br />
£m<br />
Level 3<br />
£m<br />
Level 3<br />
£m<br />
<strong>2012</strong><br />
£m<br />
Total<br />
£m<br />
Total<br />
£m<br />
2011<br />
£m<br />
<strong>Tesco</strong> PLC <strong>Annual</strong> <strong>Report</strong> <strong>and</strong> <strong>Financial</strong> <strong>Statements</strong> <strong>2012</strong> 125