SUICIDE in RURAL & REMOTE AREAS of AUSTRALIA - Living is for ...
SUICIDE in RURAL & REMOTE AREAS of AUSTRALIA - Living is for ...
SUICIDE in RURAL & REMOTE AREAS of AUSTRALIA - Living is for ...

You also want an ePaper? Increase the reach of your titles
YUMPU automatically turns print PDFs into web optimized ePapers that Google loves.
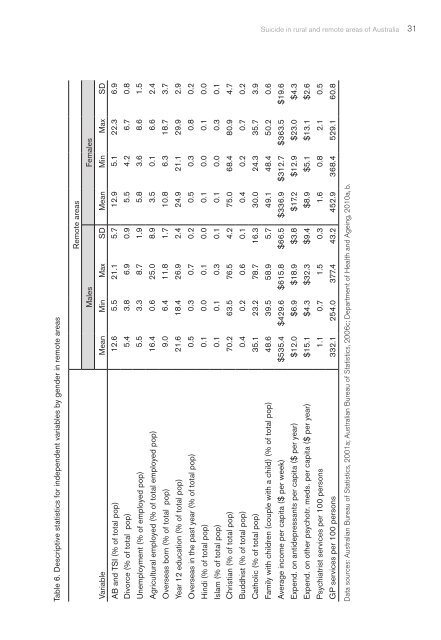
Suicide <strong>in</strong> rural and remote areas <strong>of</strong> Australia 31<br />
Table 6. Descriptive stat<strong>is</strong>tics <strong>for</strong> <strong>in</strong>dependent variables by gender <strong>in</strong> remote areas<br />
Remote areas<br />
Males Females<br />
Variable Mean M<strong>in</strong> Max SD Mean M<strong>in</strong> Max SD<br />
AB and TSI (% <strong>of</strong> total pop) 12.6 5.5 21.1 5.7 12.9 5.1 22.3 6.9<br />
Divorce (% <strong>of</strong> total pop) 5.4 3.8 6.9 0.9 5.5 4.2 6.7 0.8<br />
Unemployment (% <strong>of</strong> employed pop) 5.5 3.3 8.7 1.9 5.8 3.6 8.6 1.5<br />
Agricultural employed (% <strong>of</strong> total employed pop) 16.4 0.6 25.0 8.9 3.5 0.1 6.6 2.4<br />
Overseas born (% <strong>of</strong> total pop) 9.0 6.4 11.8 1.7 10.8 6.3 18.7 3.7<br />
Year 12 education (% <strong>of</strong> total pop) 21.6 18.4 26.9 2.4 24.9 21.1 29.9 2.9<br />
Overseas <strong>in</strong> the past year (% <strong>of</strong> total pop) 0.5 0.3 0.7 0.2 0.5 0.3 0.8 0.2<br />
H<strong>in</strong>di (% <strong>of</strong> total pop) 0.1 0.0 0.1 0.0 0.1 0.0 0.1 0.0<br />
Islam (% <strong>of</strong> total pop) 0.1 0.1 0.3 0.1 0.1 0.0 0.3 0.1<br />
Chr<strong>is</strong>tian (% <strong>of</strong> total pop) 70.2 63.5 76.5 4.2 75.0 68.4 80.9 4.7<br />
Buddh<strong>is</strong>t (% <strong>of</strong> total pop) 0.4 0.2 0.6 0.1 0.4 0.2 0.7 0.2<br />
Catholic (% <strong>of</strong> total pop) 35.1 23.2 78.7 16.3 30.0 24.3 35.7 3.9<br />
Family with children (couple with a child) (% <strong>of</strong> total pop) 48.6 39.5 58.9 5.7 49.1 48.4 50.2 0.6<br />
Average <strong>in</strong>come per capita ($ per week) $535.4 $429.6 $615.8 $66.5 $336.9 $312.7 $363.5 $19.6<br />
Expend. on antidepressants per capita ($ per year) $12.0 $6.9 $18.9 $3.8 $17.2 $12.9 $23.0 $4.3<br />
Expend. on other psychotr. meds. per capita ($ per year) $15.1 $4.3 $32.3 $9.4 $8.9 $5.1 $13.1 $2.6<br />
Psychiatr<strong>is</strong>t services per 100 persons 1.1 0.7 1.5 0.3 1.6 0.8 2.1 0.5<br />
GP services per 100 persons 332.1 254.0 377.4 43.2 452.9 368.4 529.1 60.8<br />
Data sources: Australian Bureau <strong>of</strong> Stat<strong>is</strong>tics, 2001a; Australian Bureau <strong>of</strong> Stat<strong>is</strong>tics, 2006c; Department <strong>of</strong> Health and Age<strong>in</strong>g, 2010a, b.<br />
GriffithBook FINAL 20/09.<strong>in</strong>dd 31<br />
15/11/12 4:28 PM