SUICIDE in RURAL & REMOTE AREAS of AUSTRALIA - Living is for ...
SUICIDE in RURAL & REMOTE AREAS of AUSTRALIA - Living is for ...
SUICIDE in RURAL & REMOTE AREAS of AUSTRALIA - Living is for ...

Create successful ePaper yourself
Turn your PDF publications into a flip-book with our unique Google optimized e-Paper software.
Suicide <strong>in</strong> rural and remote areas <strong>of</strong> Australia 35<br />
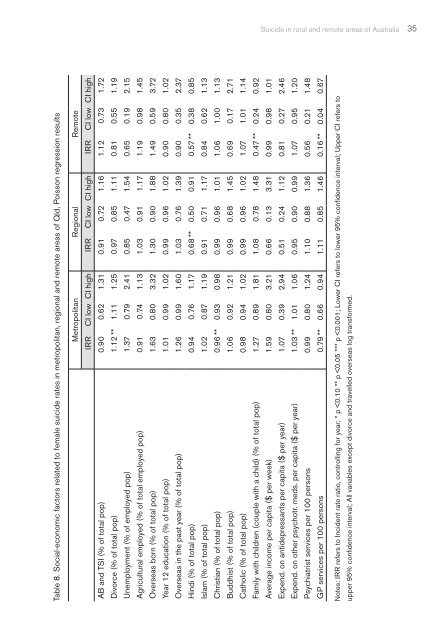
Table 8. Social-economic factors related to female suicide rates <strong>in</strong> metropolitan, regional and remote areas <strong>of</strong> Qld, Po<strong>is</strong>son regression results<br />
Metropolitan Regional Remote<br />
IRR CI low CI high IRR CI low CI high IRR CI low CI high<br />
AB and TSI (% <strong>of</strong> total pop) 0.90 0.62 1.31 0.91 0.72 1.16 1.12 0.73 1.72<br />
Divorce (% <strong>of</strong> total pop) 1.12 ** 1.11 1.25 0.97 0.85 1.11 0.81 0.55 1.19<br />
Unemployment (% <strong>of</strong> employed pop) 1.37 0.79 2.41 0.85 0.47 1.54 0.65 0.19 2.15<br />
Agricultural employed (% <strong>of</strong> total employed pop) 0.91 0.74 1.13 1.03 0.91 1.17 1.19 0.98 1.45<br />
Overseas born (% <strong>of</strong> total pop) 1.63 0.80 3.32 1.30 0.90 1.88 1.49 0.59 3.72<br />
Year 12 education (% <strong>of</strong> total pop) 1.01 0.99 1.02 0.99 0.96 1.02 0.90 0.80 1.02<br />
Overseas <strong>in</strong> the past year (% <strong>of</strong> total pop) 1.26 0.99 1.60 1.03 0.76 1.39 0.90 0.35 2.37<br />
H<strong>in</strong>di (% <strong>of</strong> total pop) 0.94 0.76 1.17 0.68 ** 0.50 0.91 0.57 ** 0.38 0.85<br />
Islam (% <strong>of</strong> total pop) 1.02 0.87 1.19 0.91 0.71 1.17 0.84 0.62 1.13<br />
Chr<strong>is</strong>tian (% <strong>of</strong> total pop) 0.96 ** 0.93 0.98 0.99 0.96 1.01 1.06 1.00 1.13<br />
Buddh<strong>is</strong>t (% <strong>of</strong> total pop) 1.06 0.92 1.21 0.99 0.68 1.45 0.69 0.17 2.71<br />
Catholic (% <strong>of</strong> total pop) 0.98 0.94 1.02 0.99 0.96 1.02 1.07 1.01 1.14<br />
Family with children (couple with a child) (% <strong>of</strong> total pop) 1.27 0.89 1.81 1.08 0.78 1.48 0.47 ** 0.24 0.92<br />
Average <strong>in</strong>come per capita ($ per week) 1.59 0.80 3.21 0.66 0.13 3.31 0.99 0.98 1.01<br />
Expend. on antidepressants per capita ($ per year) 1.07 0.39 2.94 0.51 0.24 1.12 0.81 0.27 2.46<br />
Expend. on other psychotr. meds. per capita ($ per year) 1.03 ** 1.01 1.06 0.95 0.90 0.99 1.07 0.95 1.20<br />
Psychiatr<strong>is</strong>t services per 100 persons 0.99 0.80 1.24 1.10 0.88 1.36 0.56 0.21 1.48<br />
GP services per 100 persons 0.79 ** 0.66 0.94 1.11 0.85 1.46 0.16 ** 0.04 0.67<br />
Notes: IRR refers to Incident rate ratio, controll<strong>in</strong>g <strong>for</strong> year; * p