Overview of financial results - Standard Bank - Investor Relations
Overview of financial results - Standard Bank - Investor Relations
Overview of financial results - Standard Bank - Investor Relations

Create successful ePaper yourself
Turn your PDF publications into a flip-book with our unique Google optimized e-Paper software.
Group <strong>results</strong><br />
in brief<br />
Segmental<br />
reporting<br />
Income statement<br />
analysis<br />
Balance sheet<br />
analysis<br />
Capital<br />
management<br />
Key banking legal<br />
entity information<br />
Other information<br />
and restatements<br />
Shareholder<br />
information<br />
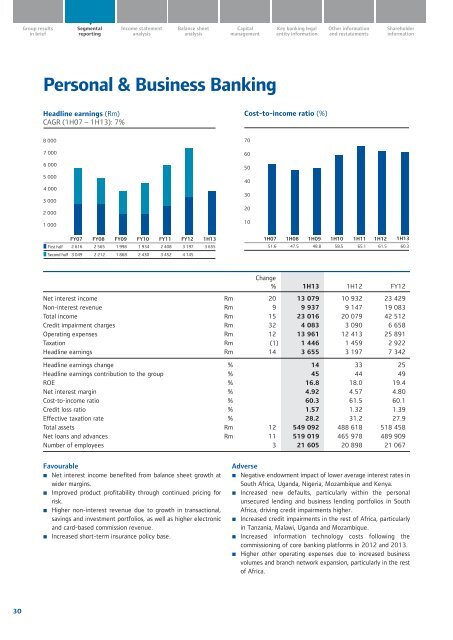
Personal & Business <strong>Bank</strong>ing<br />
Headline earnings (Rm)<br />
CAGR (1H07 – 1H13): 7%<br />
Cost-to-income ratio (%)<br />
8 000<br />
7 000<br />
6 000<br />
5 000<br />
4 000<br />
3 000<br />
2 000<br />
1 000<br />
FY07 FY08 FY09 FY10 FY11 FY12 1H13<br />
First half 2 616 2 565 1 998 1 934 2 408 3 197 3 655<br />
Second half 3 049 2 212 1 868 2 430 3 452 4 145<br />
70<br />
60<br />
50<br />
40<br />
30<br />
20<br />
10<br />
1H07 1H08 1H09 1H10 1H11 1H12 1H13<br />
51.6 47.5 48.8 58.5 65.1 61.5 60.3<br />
Change<br />
% 1H13 1H12 FY12<br />
Net interest income Rm 20 13 079 10 932 23 429<br />
Non-interest revenue Rm 9 9 937 9 147 19 083<br />
Total income Rm 15 23 016 20 079 42 512<br />
Credit impairment charges Rm 32 4 083 3 090 6 658<br />
Operating expenses Rm 12 13 961 12 413 25 891<br />
Taxation Rm (1) 1 446 1 459 2 922<br />
Headline earnings Rm 14 3 655 3 197 7 342<br />
Headline earnings change % 14 33 25<br />
Headline earnings contribution to the group % 45 44 49<br />
ROE % 16.8 18.0 19.4<br />
Net interest margin % 4.92 4.57 4.80<br />
Cost-to-income ratio % 60.3 61.5 60.1<br />
Credit loss ratio % 1.57 1.32 1.39<br />
Effective taxation rate % 28.2 31.2 27.9<br />
Total assets Rm 12 549 092 488 618 518 458<br />
Net loans and advances Rm 11 519 019 465 978 489 909<br />
Number <strong>of</strong> employees 3 21 605 20 898 21 067<br />
Favourable<br />
• Net interest income benefited from balance sheet growth at<br />
wider margins.<br />
• Improved product pr<strong>of</strong>itability through continued pricing for<br />
risk.<br />
• Higher non-interest revenue due to growth in transactional,<br />
savings and investment portfolios, as well as higher electronic<br />
and card-based commission revenue.<br />
• Increased short-term insurance policy base.<br />
Adverse<br />
• Negative endowment impact <strong>of</strong> lower average interest rates in<br />
South Africa, Uganda, Nigeria, Mozambique and Kenya.<br />
• Increased new defaults, particularly within the personal<br />
unsecured lending and business lending portfolios in South<br />
Africa, driving credit impairments higher.<br />
• Increased credit impairments in the rest <strong>of</strong> Africa, particularly<br />
in Tanzania, Malawi, Uganda and Mozambique.<br />
• Increased information technology costs following the<br />
commissioning <strong>of</strong> core banking platforms in 2012 and 2013.<br />
• Higher other operating expenses due to increased business<br />
volumes and branch network expansion, particularly in the rest<br />
<strong>of</strong> Africa.<br />
30