Overview of financial results - Standard Bank - Investor Relations
Overview of financial results - Standard Bank - Investor Relations
Overview of financial results - Standard Bank - Investor Relations

Create successful ePaper yourself
Turn your PDF publications into a flip-book with our unique Google optimized e-Paper software.
Group <strong>results</strong><br />
in brief<br />
Segmental<br />
reporting<br />
Income statement<br />
analysis<br />
Balance sheet<br />
analysis<br />
Capital<br />
management<br />
Key banking legal<br />
entity information<br />
Other information<br />
and restatements<br />
Shareholder<br />
information<br />
<strong>Standard</strong> <strong>Bank</strong> Group Analysis <strong>of</strong> <strong>financial</strong> <strong>results</strong> for the six months ended 30 June 2013<br />
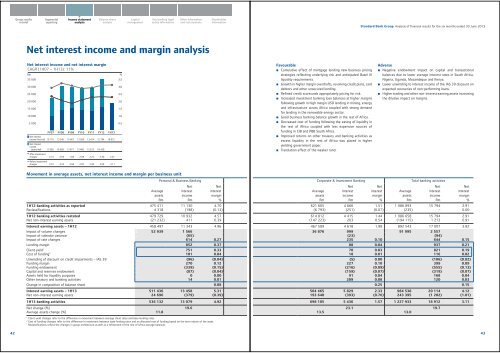
Net interest income and margin analysis<br />
Net interest income and net interest margin<br />
CAGR (1H07 – 1H13): 11%<br />
Rm %<br />
35 000<br />
30 000<br />
25 000<br />
20 000<br />
15 000<br />
10 000<br />
5 000<br />
FY07<br />
FY08<br />
FY09<br />
FY10<br />
FY11<br />
FY12<br />
1H13<br />
Net interest<br />
income-first half 10 110 13 740 15 467 13 568 13 414 15 794 18 912<br />
Net interest<br />
income<br />
- second half 11 958 16 589 13 971 13 460 15 613 18 439<br />
After impairment<br />
charges 2.31 2.05 1.84 2.09 2.27 2.30 2.27<br />
Before impairment<br />
charges 2.91 3.23 3.06 2.87 2.92 3.09 3.11<br />
3.5<br />
3.0<br />
2.5<br />
2.0<br />
1.5<br />
1.0<br />
0.5<br />
Favourable<br />
Cumulative effect <strong>of</strong> mortgage lending new business pricing<br />
strategies reflecting underlying risk and anticipated Basel III<br />
liquidity requirements.<br />
Growth in higher margin overdrafts, revolving credit plans, card<br />
debtors and other unsecured lending.<br />
Refined credit scorecards appropriately pricing for risk.<br />
Increased investment banking loan balances at higher margins<br />
following growth in high margin USD lending in mining, energy<br />
and infrastructure across Africa coupled with strong demand<br />
for lending in the renewable energy sector.<br />
Good business banking balance growth in the rest <strong>of</strong> Africa.<br />
Decreased cost <strong>of</strong> funding following the easing <strong>of</strong> liquidity in<br />
the rest <strong>of</strong> Africa coupled with less expensive sources <strong>of</strong><br />
funding in CIB and PBB South Africa.<br />
Improved returns on other treasury and banking activities as<br />
excess liquidity in the rest <strong>of</strong> Africa was placed in higher<br />
yielding government paper.<br />
Translation effect <strong>of</strong> the weaker rand.<br />
Adverse<br />
Negative endowment impact on capital and transactional<br />
balances due to lower average interest rates in South Africa,<br />
Nigeria, Uganda, Mozambique and Kenya.<br />
Lower unwinding to interest income <strong>of</strong> the IAS 39 discount on<br />
expected recoveries <strong>of</strong> non-performing loans.<br />
Higher trading and other non-interest earning assets increasing<br />
the dilutive impact on margins.<br />
Movement in average assets, net interest income and margin per business unit<br />
Personal & Business <strong>Bank</strong>ing<br />
Average<br />
assets<br />
Rm<br />
Net<br />
interest<br />
income<br />
Rm<br />
Net<br />
interest<br />
margin<br />
%<br />
1H12 banking activities as reported 475 411 11 130 4.70<br />
Reclassifications 4 318 (198) (0.13)<br />
1H12 banking activities restated 479 729 10 932 4.57<br />
Net non-interest earning assets (21 232) 411 0.39<br />
Interest earning assets – 1H12 458 497 11 343 4.96<br />
Impact <strong>of</strong> volume changes 52 939 1 566<br />
Impact <strong>of</strong> calendar variance (65)<br />
Impact <strong>of</strong> rate changes 614 0.27<br />
Lending margin 852 0.37<br />
Client yield 1 751 0.33<br />
Cost <strong>of</strong> funding 2 101 0.04<br />
Unwinding <strong>of</strong> discount on credit impairments – IAS 39 (96) (0.04)<br />
Funding margin 270 0.12<br />
Funding endowment (339) (0.15)<br />
Capital and reserves endowment (87) (0.04)<br />
Assets held for liquidity purposes 0 0.00<br />
Other treasury and banking activities 14 0.01<br />
Change in composition <strong>of</strong> balance sheet 0.08<br />
Interest earning assets – 1H13 511 436 13 458 5.31<br />
Net non-interest earning assets 24 696 (379) (0.39)<br />
1H13 banking activities 536 132 13 079 4.92<br />
Net change (%) 19.6<br />
Average assets change (%) 11.8<br />
1<br />
Client yield changes refer to the difference in movement between average client rates and base lending rates.<br />
2<br />
Cost <strong>of</strong> funding changes refer to the difference in movement between base lending rates and an allocated cost <strong>of</strong> funding based on the term nature <strong>of</strong> the asset.<br />
*<br />
Reclassifications reflect the changes in group architecture as well as a refinement <strong>of</strong> the rest <strong>of</strong> Africa average balances<br />
Corporate & Investment <strong>Bank</strong>ing<br />
Average<br />
assets<br />
Rm<br />
Net<br />
interest<br />
income<br />
Rm<br />
Net<br />
interest<br />
margin<br />
%<br />
Average<br />
assets<br />
Rm<br />
Total banking activities<br />
Net<br />
interest<br />
income<br />
Rm<br />
Net<br />
interest<br />
margin<br />
%<br />
621 605 4 666 1.51 1 086 893 15 794 2.91<br />
(6 793) (251) (0.07) (235) – 0.00<br />
614 812 4 415 1.44 1 086 658 15 794 2.91<br />
(147 223) 203 0.54 (194 115) 1 213 0.91<br />
467 589 4 618 1.98 892 543 17 007 3.82<br />
36 876 999 91 995 2 557<br />
(23) (94)<br />
235 0.10 644 0.15<br />
88 0.04 937 0.21<br />
70 0.03 821 0.19<br />
18 0.01 116 0.02<br />
(5) 0.00 (106) (0.02)<br />
227 0.10 399 0.09<br />
(216) (0.09) (555) (0.13)<br />
(159) (0.07) (319) (0.07)<br />
91 0.04 168 0.04<br />
209 0.08 120 0.03<br />
0.25 0.15<br />
504 465 5 829 2.33 984 538 20 114 4.12<br />
193 640 (393) (0.76) 243 395 (1 202) (1.01)<br />
698 105 5 436 1.57 1 227 933 18 912 3.11<br />
23.1 19.7<br />
13.5 13.0<br />
42<br />
43