

Reading 2009 - African American Communication and Collaboration ...
Reading 2009 - African American Communication and Collaboration ...
Reading 2009 - African American Communication and Collaboration ...

You also want an ePaper? Increase the reach of your titles
YUMPU automatically turns print PDFs into web optimized ePapers that Google loves.
GRADE<br />
4<br />
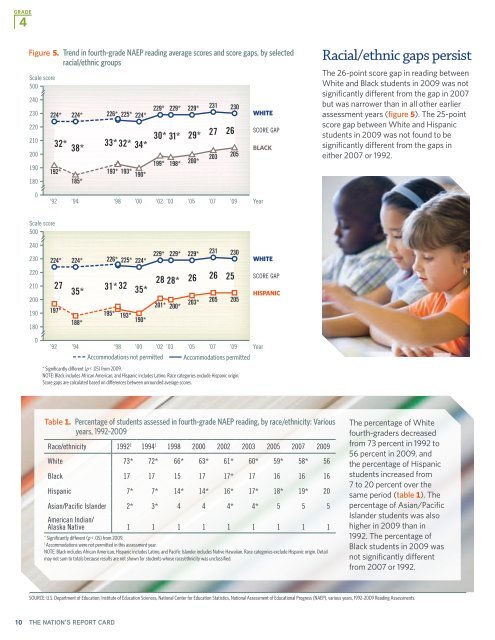
Figure 5. Trend in fourth-grade NAEP reading average scores <strong>and</strong> score gaps, by selected<br />
racial/ethnic groups<br />
Scale score<br />
500<br />
240<br />
230<br />
220<br />
210<br />
200<br />
190<br />
180<br />
224* 224* 226* 225* 224*<br />
32* 38*<br />
33*32* 34*<br />
192*<br />
185*<br />
193* 193*<br />
190*<br />
229*<br />
30* 31*<br />
199*<br />
229* 229*<br />
29*<br />
198* 200*<br />
231<br />
27 26<br />
230<br />
203 205<br />
WHITE<br />
SCORE GAP<br />
BLACK<br />
Racial/ethnic gaps persist<br />
The 26-point score gap in reading between<br />
White <strong>and</strong> Black students in <strong>2009</strong> was not<br />
significantly different from the gap in 2007<br />
but was narrower than in all other earlier<br />
assessment years (figure 5). The 25-point<br />
score gap between White <strong>and</strong> Hispanic<br />
students in <strong>2009</strong> was not found to be<br />
significantly different from the gaps in<br />
either 2007 or 1992.<br />
0<br />
’92 ’94 ’98 ’00 ’02 ’03 ’05 ’07 ’09<br />
Year<br />
Scale score<br />
500<br />
240<br />
230<br />
220<br />
210<br />
200<br />
190<br />
180<br />
229* 229* 229*<br />
231 230<br />
224* 224* 226* 225* 224*<br />
27 35*<br />
31*32 35*<br />
28 28* 26 26 25<br />
205 205<br />
201*<br />
203*<br />
200*<br />
197*<br />
195* 193*<br />
188*<br />
190*<br />
WHITE<br />
SCORE GAP<br />
HISPANIC<br />
0<br />
’92 ’94 ’98 ’00 ’02 ’03 ’05 ’07 ’09 Year<br />
Accommodations not permitted Accommodations permitted<br />
* Significantly different (p < .05) from <strong>2009</strong>.<br />
NOTE: Black includes <strong>African</strong> <strong>American</strong>, <strong>and</strong> Hispanic includes Latino. Race categories exclude Hispanic origin.<br />
Score gaps are calculated based on differences between unrounded average scores.<br />
Table 1. Percentage of students assessed in fourth-grade NAEP reading, by race/ethnicity: Various<br />
years, 1992–<strong>2009</strong><br />
Race/ethnicity 1992 1 1994 1 1998 2000 2002 2003 2005 2007 <strong>2009</strong><br />
White 73* 72* 66* 63* 61* 60* 59* 58* 56<br />
Black 17 17 15 17 17* 17 16 16 16<br />
Hispanic 7* 7* 14* 14* 16* 17* 18* 19* 20<br />
Asian/Pacific Isl<strong>and</strong>er 2* 3* 4 4 4* 4* 5 5 5<br />
<strong>American</strong> Indian/<br />
Alaska Native 1 1 1 1 1 1 1 1 1<br />
* Significantly different (p < .05) from <strong>2009</strong>.<br />
1<br />
Accommodations were not permitted in this assessment year.<br />
NOTE: Black includes <strong>African</strong> <strong>American</strong>, Hispanic includes Latino, <strong>and</strong> Pacific Isl<strong>and</strong>er includes Native Hawaiian. Race categories exclude Hispanic origin. Detail<br />
may not sum to totals because results are not shown for students whose race/ethnicity was unclassified.<br />
The percentage of White<br />
fourth-graders decreased<br />
from 73 percent in 1992 to<br />
56 percent in <strong>2009</strong>, <strong>and</strong><br />
the percentage of Hispanic<br />
students increased from<br />
7 to 20 percent over the<br />
same period (table 1). The<br />
percentage of Asian/Pacific<br />
Isl<strong>and</strong>er students was also<br />
higher in <strong>2009</strong> than in<br />
1992. The percentage of<br />
Black students in <strong>2009</strong> was<br />
not significantly different<br />
from 2007 or 1992.<br />
SOURCE: U.S. Department of Education, Institute of Education Sciences, National Center for Education Statistics, National Assessment of Educational Progress (NAEP), various years, 1992–<strong>2009</strong> <strong>Reading</strong> Assessments.<br />
10 THE NATION’S REPORT CARD