

Reading 2009 - African American Communication and Collaboration ...
Reading 2009 - African American Communication and Collaboration ...
Reading 2009 - African American Communication and Collaboration ...

Create successful ePaper yourself
Turn your PDF publications into a flip-book with our unique Google optimized e-Paper software.
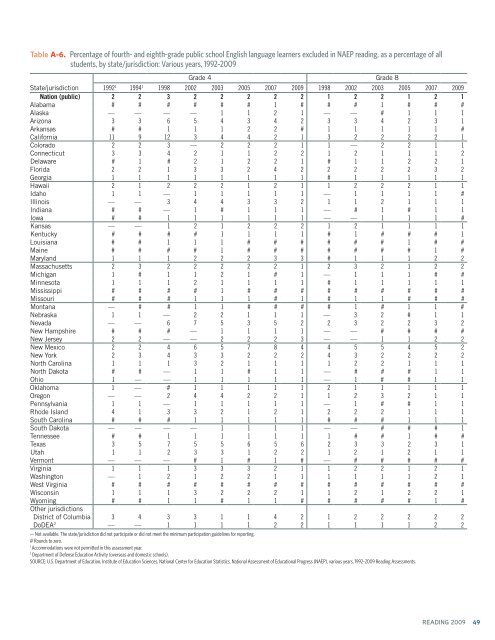
Table A-6. Percentage of fourth- <strong>and</strong> eighth-grade public school English language learners excluded in NAEP reading, as a percentage of all<br />
students, by state/jurisdiction: Various years, 1992–<strong>2009</strong><br />
Grade 4 Grade 8<br />
State/jurisdiction 1992 1 1994 1 1998 2002 2003 2005 2007 <strong>2009</strong> 1998 2002 2003 2005 2007 <strong>2009</strong><br />
Nation (public) 2 2 3 2 2 2 2 2 1 2 2 1 2 1<br />
Alabama # # # # # # 1 # # # 1 # # #<br />
Alaska — — — — 1 1 2 1 — — # 1 1 1<br />
Arizona 3 3 6 5 4 3 4 2 3 3 4 2 3 1<br />
Arkansas # # 1 1 1 2 2 # 1 1 1 1 1 #<br />
California 11 9 12 3 4 4 2 1 3 2 2 2 2 1<br />
Colorado 2 2 3 — 2 2 2 1 1 — 2 2 1 1<br />
Connecticut 3 3 4 2 1 1 2 2 1 2 1 1 1 2<br />
Delaware # 1 # 2 1 2 2 1 # 1 1 2 2 1<br />
Florida 2 2 1 3 3 2 4 2 2 2 2 2 3 2<br />
Georgia 1 1 1 1 1 1 1 1 # 1 1 1 1 1<br />
Hawaii 2 1 2 2 2 1 2 1 1 2 2 2 1 1<br />
Idaho 1 1 — 1 1 1 1 1 — 1 1 1 1 #<br />
Illinois — — 3 4 4 3 3 2 1 1 2 1 1 1<br />
Indiana # # — 1 # 1 1 1 — # 1 # 1 1<br />
Iowa # # 1 1 1 1 1 1 — — 1 1 1 #<br />
Kansas — — 1 2 1 2 2 2 1 2 1 1 1 1<br />
Kentucky # # # # 1 1 1 1 # 1 # # # 1<br />
Louisiana # # 1 1 1 # # # # # # 1 # #<br />
Maine # # # # 1 # # # # # # # 1 #<br />
Maryl<strong>and</strong> 1 1 1 2 2 2 3 3 # 1 1 1 2 2<br />
Massachusetts 2 3 2 2 2 2 2 1 2 3 2 1 2 2<br />
Michigan 1 # 1 1 2 1 # 1 — 1 1 1 # #<br />
Minnesota 1 1 1 2 1 1 1 1 # 1 1 1 1 1<br />
Mississippi # # # # 1 # # # # # # # # #<br />
Missouri # # # 1 1 1 # 1 # 1 1 # # #<br />
Montana — # # 1 1 # # # # 1 # 1 1 #<br />
Nebraska 1 1 — 2 2 1 1 1 — 3 2 # 1 1<br />
Nevada — — 6 7 5 3 5 2 2 3 2 2 3 2<br />
New Hampshire # # # — 1 1 1 1 — — # # # #<br />
New Jersey 2 2 — — 2 2 2 3 — — 1 1 2 2<br />
New Mexico 2 2 4 6 5 7 8 4 4 5 5 4 5 2<br />
New York 2 3 4 3 3 2 2 2 4 3 2 2 2 2<br />
North Carolina 1 1 1 3 2 1 1 1 1 2 2 1 1 1<br />
North Dakota # # — 1 1 # 1 1 — # # # 1 1<br />
Ohio 1 — — 1 1 1 1 1 — 1 # # 1 1<br />
Oklahoma 1 — # 1 1 1 1 1 2 1 1 1 1 1<br />
Oregon — — 2 4 4 2 2 1 1 2 3 2 1 1<br />
Pennsylvania 1 1 — 1 1 1 1 1 — 1 # # 1 1<br />
Rhode Isl<strong>and</strong> 4 1 3 3 2 1 2 1 2 2 2 1 1 1<br />
South Carolina # # # 1 1 1 1 1 # # # 1 1 1<br />
South Dakota — — — — 1 1 1 1 — — # # # 1<br />
Tennessee # # 1 1 1 1 1 1 1 # # 1 # #<br />
Texas 3 5 7 5 5 6 5 6 2 3 3 2 3 1<br />
Utah 1 1 2 3 3 1 2 2 1 2 1 2 1 1<br />
Vermont — — — # 1 # 1 # — # # # # #<br />
Virginia 1 1 1 3 3 3 2 1 1 2 2 1 2 1<br />
Washington — 1 2 1 2 2 1 1 1 1 1 1 2 1<br />
West Virginia # # # # # # # # # # # # # #<br />
Wisconsin 1 1 1 3 2 2 2 1 1 2 1 2 2 1<br />
Wyoming # # 1 1 # 1 1 # # # # # 1 #<br />
Other jurisdictions<br />
District of Columbia 3 4 3 3 1 1 4 2 1 2 2 2 2 2<br />
DoDEA 2 — — 1 1 1 1 2 2 1 1 1 1 2 2<br />
— Not available. The state/jurisdiction did not participate or did not meet the minimum participation guidelines for reporting.<br />
# Rounds to zero.<br />
1<br />
Accommodations were not permitted in this assessment year.<br />
2<br />
Department of Defense Education Activity (overseas <strong>and</strong> domestic schools).<br />
SOURCE: U.S. Department of Education, Institute of Education Sciences, National Center for Education Statistics, National Assessment of Educational Progress (NAEP), various years, 1992–<strong>2009</strong> <strong>Reading</strong> Assessments.<br />
READING <strong>2009</strong><br />
49