

Reading 2009 - African American Communication and Collaboration ...
Reading 2009 - African American Communication and Collaboration ...
Reading 2009 - African American Communication and Collaboration ...

Create successful ePaper yourself
Turn your PDF publications into a flip-book with our unique Google optimized e-Paper software.
GRADE<br />
8<br />
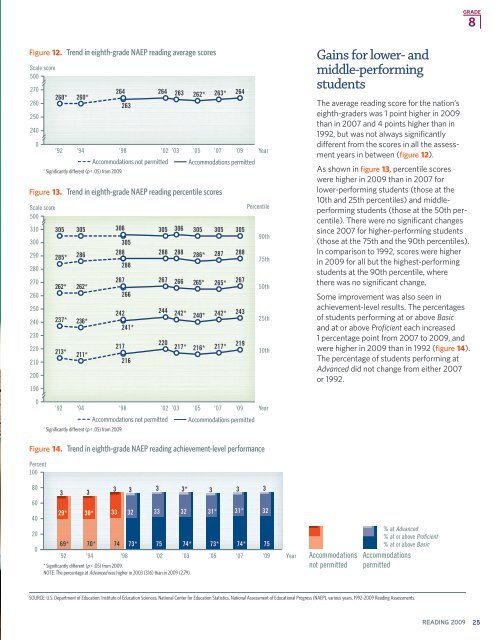
Figure 12. Trend in eighth-grade NAEP reading average scores<br />
Scale score<br />
500<br />
270<br />
260<br />
250<br />
240<br />
0<br />
Figure 13. Trend in eighth-grade NAEP reading percentile scores<br />
Scale score<br />
500<br />
310<br />
300<br />
290<br />
280<br />
270<br />
260<br />
250<br />
240<br />
230<br />
220<br />
210<br />
200<br />
190<br />
260*<br />
285*<br />
262*<br />
237*<br />
213*<br />
260*<br />
305 305 306 305 306 305 305 305<br />
286<br />
262*<br />
236*<br />
211*<br />
264<br />
* Significantly different (p < .05) from <strong>2009</strong>.<br />
305<br />
288<br />
267<br />
242<br />
217<br />
263<br />
Accommodations not permitted<br />
288<br />
266<br />
241*<br />
216<br />
264 263 262* 263* 264<br />
’92 ’94 ’98 ’02 ’03 ’05 ’07 ’09<br />
288<br />
267<br />
244<br />
220<br />
288<br />
266<br />
242*<br />
217*<br />
Accommodations permitted<br />
286*<br />
265*<br />
240*<br />
216*<br />
287 288<br />
265*<br />
242* 243<br />
217*<br />
267<br />
219<br />
Year<br />
Percentile<br />
90th<br />
75th<br />
50th<br />
25th<br />
10th<br />
Gains for lower- <strong>and</strong><br />
middle-performing<br />
students<br />
The average reading score for the nation’s<br />
eighth-graders was 1 point higher in <strong>2009</strong><br />
than in 2007 <strong>and</strong> 4 points higher than in<br />
1992, but was not always significantly<br />
different from the scores in all the assessment<br />
years in between (figure 12).<br />
As shown in figure 13, percentile scores<br />
were higher in <strong>2009</strong> than in 2007 for<br />
lower-performing students (those at the<br />
10th <strong>and</strong> 25th percentiles) <strong>and</strong> middleperforming<br />
students (those at the 50th percentile).<br />
There were no significant changes<br />
since 2007 for higher-performing students<br />
(those at the 75th <strong>and</strong> the 90th percentiles).<br />
In comparison to 1992, scores were higher<br />
in <strong>2009</strong> for all but the highest-performing<br />
students at the 90th percentile, where<br />
there was no significant change.<br />
Some improvement was also seen in<br />
achievement-level results. The percentages<br />
of students performing at or above Basic<br />
<strong>and</strong> at or above Proficient each increased<br />
1 percentage point from 2007 to <strong>2009</strong>, <strong>and</strong><br />
were higher in <strong>2009</strong> than in 1992 (figure 14).<br />
The percentage of students performing at<br />
Advanced did not change from either 2007<br />
or 1992.<br />
0<br />
’92 ’94 ’98 ’02 ’03 ’05 ’07 ’09<br />
Accommodations not permitted Accommodations permitted<br />
* Significantly different (p < .05) from <strong>2009</strong>.<br />
Year<br />
Figure 14. Trend in eighth-grade NAEP reading achievement-level performance<br />
Percent<br />
100<br />
80<br />
60<br />
40<br />
20<br />
0<br />
3<br />
29*<br />
69*<br />
3<br />
3<br />
74<br />
73*<br />
74*<br />
’92 ’94 ’98 ’02 ’03<br />
* Significantly different (p < .05) from <strong>2009</strong>.<br />
NOTE: The percentage at Advanced was higher in 2003 (3.16) than in <strong>2009</strong> (2.79).<br />
3<br />
3<br />
30* 33 32 33 32 31* 31*<br />
70*<br />
75<br />
3*<br />
3<br />
73*<br />
’05<br />
3<br />
3<br />
32<br />
74* 75<br />
’07 ’09<br />
Year<br />
Accommodations<br />
not permitted<br />
% at Advanced<br />
% at or above Proficient<br />
% at or above Basic<br />
Accommodations<br />
permitted<br />
SOURCE: U.S. Department of Education, Institute of Education Sciences, National Center for Education Statistics, National Assessment of Educational Progress (NAEP), various years, 1992–<strong>2009</strong> <strong>Reading</strong> Assessments.<br />
READING <strong>2009</strong><br />
25