

Reading 2009 - African American Communication and Collaboration ...
Reading 2009 - African American Communication and Collaboration ...
Reading 2009 - African American Communication and Collaboration ...

You also want an ePaper? Increase the reach of your titles
YUMPU automatically turns print PDFs into web optimized ePapers that Google loves.
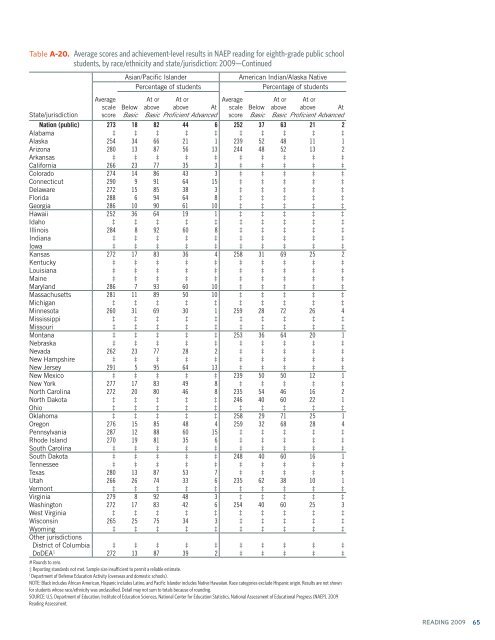
Table A-20. Average scores <strong>and</strong> achievement-level results in NAEP reading for eighth-grade public school<br />
students, by race/ethnicity <strong>and</strong> state/jurisdiction: <strong>2009</strong>—Continued<br />
State/jurisdiction<br />
Average<br />
scale<br />
score<br />
Asian/Pacific Isl<strong>and</strong>er<br />
Percentage of students<br />
Below<br />
Basic<br />
At or<br />
above<br />
Basic<br />
At or<br />
above<br />
Proficient<br />
At<br />
Advanced<br />
Average<br />
scale<br />
score<br />
<strong>American</strong> Indian/Alaska Native<br />
Percentage of students<br />
Below<br />
Basic<br />
At or<br />
above<br />
Basic<br />
At or<br />
above<br />
Proficient<br />
At<br />
Advanced<br />
Nation (public) 273 18 82 44 6 252 37 63 21 2<br />
Alabama ‡ ‡ ‡ ‡ ‡ ‡ ‡ ‡ ‡ ‡<br />
Alaska 254 34 66 21 1 239 52 48 11 1<br />
Arizona 280 13 87 56 13 244 48 52 13 2<br />
Arkansas ‡ ‡ ‡ ‡ ‡ ‡ ‡ ‡ ‡ ‡<br />
California 266 23 77 35 3 ‡ ‡ ‡ ‡ ‡<br />
Colorado 274 14 86 43 3 ‡ ‡ ‡ ‡ ‡<br />
Connecticut 290 9 91 64 15 ‡ ‡ ‡ ‡ ‡<br />
Delaware 272 15 85 38 3 ‡ ‡ ‡ ‡ ‡<br />
Florida 288 6 94 64 8 ‡ ‡ ‡ ‡ ‡<br />
Georgia 286 10 90 61 10 ‡ ‡ ‡ ‡ ‡<br />
Hawaii 252 36 64 19 1 ‡ ‡ ‡ ‡ ‡<br />
Idaho ‡ ‡ ‡ ‡ ‡ ‡ ‡ ‡ ‡ ‡<br />
Illinois 284 8 92 60 8 ‡ ‡ ‡ ‡ ‡<br />
Indiana ‡ ‡ ‡ ‡ ‡ ‡ ‡ ‡ ‡ ‡<br />
Iowa ‡ ‡ ‡ ‡ ‡ ‡ ‡ ‡ ‡ ‡<br />
Kansas 272 17 83 36 4 258 31 69 25 2<br />
Kentucky ‡ ‡ ‡ ‡ ‡ ‡ ‡ ‡ ‡ ‡<br />
Louisiana ‡ ‡ ‡ ‡ ‡ ‡ ‡ ‡ ‡ ‡<br />
Maine ‡ ‡ ‡ ‡ ‡ ‡ ‡ ‡ ‡ ‡<br />
Maryl<strong>and</strong> 286 7 93 60 10 ‡ ‡ ‡ ‡ ‡<br />
Massachusetts 281 11 89 50 10 ‡ ‡ ‡ ‡ ‡<br />
Michigan ‡ ‡ ‡ ‡ ‡ ‡ ‡ ‡ ‡ ‡<br />
Minnesota 260 31 69 30 1 259 28 72 26 4<br />
Mississippi ‡ ‡ ‡ ‡ ‡ ‡ ‡ ‡ ‡ ‡<br />
Missouri ‡ ‡ ‡ ‡ ‡ ‡ ‡ ‡ ‡ ‡<br />
Montana ‡ ‡ ‡ ‡ ‡ 253 36 64 20 1<br />
Nebraska ‡ ‡ ‡ ‡ ‡ ‡ ‡ ‡ ‡ ‡<br />
Nevada 262 23 77 28 2 ‡ ‡ ‡ ‡ ‡<br />
New Hampshire ‡ ‡ ‡ ‡ ‡ ‡ ‡ ‡ ‡ ‡<br />
New Jersey 291 5 95 64 13 ‡ ‡ ‡ ‡ ‡<br />
New Mexico ‡ ‡ ‡ ‡ ‡ 239 50 50 12 1<br />
New York 277 17 83 49 8 ‡ ‡ ‡ ‡ ‡<br />
North Carolina 272 20 80 46 8 235 54 46 16 2<br />
North Dakota ‡ ‡ ‡ ‡ ‡ 246 40 60 22 1<br />
Ohio ‡ ‡ ‡ ‡ ‡ ‡ ‡ ‡ ‡ ‡<br />
Oklahoma ‡ ‡ ‡ ‡ ‡ 258 29 71 25 1<br />
Oregon 276 15 85 48 4 259 32 68 28 4<br />
Pennsylvania 287 12 88 60 15 ‡ ‡ ‡ ‡ ‡<br />
Rhode Isl<strong>and</strong> 270 19 81 35 6 ‡ ‡ ‡ ‡ ‡<br />
South Carolina ‡ ‡ ‡ ‡ ‡ ‡ ‡ ‡ ‡ ‡<br />
South Dakota ‡ ‡ ‡ ‡ ‡ 248 40 60 16 1<br />
Tennessee ‡ ‡ ‡ ‡ ‡ ‡ ‡ ‡ ‡ ‡<br />
Texas 280 13 87 53 7 ‡ ‡ ‡ ‡ ‡<br />
Utah 266 26 74 33 6 235 62 38 10 1<br />
Vermont ‡ ‡ ‡ ‡ ‡ ‡ ‡ ‡ ‡ ‡<br />
Virginia 279 8 92 48 3 ‡ ‡ ‡ ‡ ‡<br />
Washington 272 17 83 42 6 254 40 60 25 3<br />
West Virginia ‡ ‡ ‡ ‡ ‡ ‡ ‡ ‡ ‡ ‡<br />
Wisconsin 265 25 75 34 3 ‡ ‡ ‡ ‡ ‡<br />
Wyoming ‡ ‡ ‡ ‡ ‡ ‡ ‡ ‡ ‡ ‡<br />
Other jurisdictions<br />
District of Columbia ‡ ‡ ‡ ‡ ‡ ‡ ‡ ‡ ‡ ‡<br />
DoDEA 1 272 13 87 39 2 ‡ ‡ ‡ ‡ ‡<br />
# Rounds to zero.<br />
‡ Reporting st<strong>and</strong>ards not met. Sample size insufficient to permit a reliable estimate.<br />
1<br />
Department of Defense Education Activity (overseas <strong>and</strong> domestic schools).<br />
NOTE: Black includes <strong>African</strong> <strong>American</strong>, Hispanic includes Latino, <strong>and</strong> Pacific Isl<strong>and</strong>er includes Native Hawaiian. Race categories exclude Hispanic origin. Results are not shown<br />
for students whose race/ethnicity was unclassified. Detail may not sum to totals because of rounding.<br />
SOURCE: U.S. Department of Education, Institute of Education Sciences, National Center for Education Statistics, National Assessment of Educational Progress (NAEP), <strong>2009</strong><br />
<strong>Reading</strong> Assessment.<br />
READING <strong>2009</strong><br />
65