

Reading 2009 - African American Communication and Collaboration ...
Reading 2009 - African American Communication and Collaboration ...
Reading 2009 - African American Communication and Collaboration ...

Create successful ePaper yourself
Turn your PDF publications into a flip-book with our unique Google optimized e-Paper software.
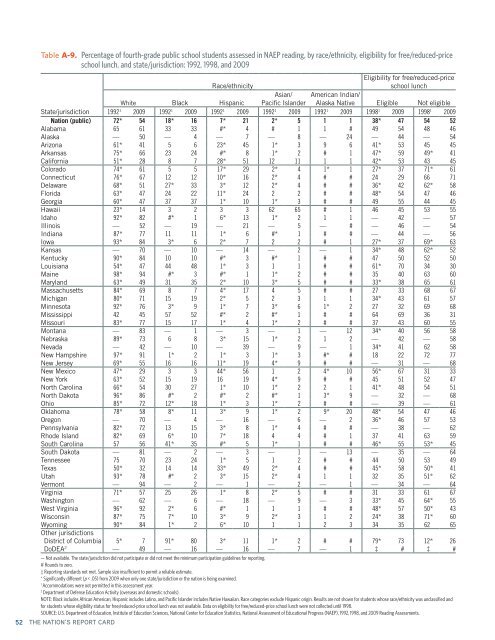
Table A-9. Percentage of fourth-grade public school students assessed in NAEP reading, by race/ethnicity, eligibility for free/reduced-price<br />
school lunch, <strong>and</strong> state/jurisdiction: 1992, 1998, <strong>and</strong> <strong>2009</strong><br />
Eligibility for free/reduced-price<br />
Race/ethnicity<br />
school lunch<br />
White Black Hispanic<br />
Asian/<br />
Pacific Isl<strong>and</strong>er<br />
<strong>American</strong> Indian/<br />
Alaska Native Eligible Not eligible<br />
State/jurisdiction 1992 1 <strong>2009</strong> 1992 1 <strong>2009</strong> 1992 1 <strong>2009</strong> 1992 1 <strong>2009</strong> 1992 1 <strong>2009</strong> 1998 1 <strong>2009</strong> 1998 1 <strong>2009</strong><br />
Nation (public) 72* 54 18* 16 7* 21 2* 5 1 1 38* 47 54 52<br />
Alabama 65 61 33 33 #* 4 # 1 1 # 49 54 48 46<br />
Alaska — 50 — 4 — 7 — 8 — 24 — 44 — 54<br />
Arizona 61* 41 5 6 23* 45 1* 3 9 6 41* 53 45 45<br />
Arkansas 75* 66 23 24 #* 8 1* 2 # 1 47* 59 49* 41<br />
California 51* 28 8 7 28* 51 12 11 1 1 42* 53 43 45<br />
Colorado 74* 61 5 5 17* 29 2* 4 1* 1 27* 37 71* 61<br />
Connecticut 76* 67 12 12 10* 16 2* 4 # # 24 29 66 71<br />
Delaware 68* 51 27* 33 3* 12 2* 4 # # 36* 42 62* 58<br />
Florida 63* 47 24 22 11* 24 2 2 # # 48* 54 47 46<br />
Georgia 60* 47 37 37 1* 10 1* 3 # # 49 55 44 45<br />
Hawaii 23* 14 3 2 3 3 62 65 # 1 46 45 53 55<br />
Idaho 92* 82 #* 1 6* 13 1* 2 1 1 — 42 — 57<br />
Illinois — 52 — 19 — 21 — 5 — # — 46 — 54<br />
Indiana 87* 77 11 11 1* 6 #* 1 # # — 44 — 56<br />
Iowa 93* 84 3* 6 2* 7 2 2 # 1 27* 37 69* 63<br />
Kansas — 70 — 10 — 14 — 2 — 1 34* 48 62* 52<br />
Kentucky 90* 84 10 10 #* 3 #* 1 # # 47 50 52 50<br />
Louisiana 54* 47 44 48 1* 3 1 1 # # 61* 70 34 30<br />
Maine 98* 94 #* 3 #* 1 1* 2 # # 35 40 63 60<br />
Maryl<strong>and</strong> 63* 49 31 35 2* 10 3* 5 # # 33* 38 65 61<br />
Massachusetts 84* 69 8 7 4* 17 4 5 # # 27 33 68 67<br />
Michigan 80* 71 15 19 2* 5 2 3 1 1 34* 43 61 57<br />
Minnesota 92* 76 3* 9 1* 7 3* 6 1* 2 27 32 69 68<br />
Mississippi 42 45 57 52 #* 2 #* 1 # # 64 69 36 31<br />
Missouri 83* 77 15 17 1* 4 1* 2 # # 37 43 60 55<br />
Montana — 83 — 1 — 3 — 1 — 12 34* 40 56 58<br />
Nebraska 89* 73 6 8 3* 15 1* 2 1 2 — 42 — 58<br />
Nevada — 42 — 10 — 39 — 9 — 1 34* 41 62 58<br />
New Hampshire 97* 91 1* 2 1* 3 1* 3 #* # 18 22 72 77<br />
New Jersey 69* 55 16 16 11* 19 4* 9 # # — 31 — 68<br />
New Mexico 47* 29 3 3 44* 56 1 2 4* 10 56* 67 31 33<br />
New York 63* 52 15 19 16 19 4* 9 # # 45 51 52 47<br />
North Carolina 66* 54 30 27 1* 10 1* 2 2 1 41* 48 54 51<br />
North Dakota 96* 86 #* 2 #* 2 #* 1 3* 9 — 32 — 68<br />
Ohio 85* 72 12* 18 1* 3 1* 2 # # — 39 — 61<br />
Oklahoma 78* 58 8* 11 3* 9 1* 2 9* 20 48* 54 47 46<br />
Oregon — 70 — 4 — 16 — 6 — 2 36* 46 57 53<br />
Pennsylvania 82* 72 13 15 3* 8 1* 4 # # — 38 — 62<br />
Rhode Isl<strong>and</strong> 82* 69 6* 10 7* 18 4 4 # 1 37 41 63 59<br />
South Carolina 57 56 41* 35 #* 5 1* 1 # # 46* 55 53* 45<br />
South Dakota — 81 — 2 — 3 — 1 — 13 — 35 — 64<br />
Tennessee 75 70 23 24 1* 5 1 2 # # 44 50 53 49<br />
Texas 50* 32 14 14 33* 49 2* 4 # # 45* 58 50* 41<br />
Utah 93* 78 #* 2 3* 15 2* 4 1 1 32 35 51* 62<br />
Vermont — 94 — 2 — 1 — 2 — 1 — 34 — 64<br />
Virginia 71* 57 25 26 1* 8 2* 5 # # 31 33 61 67<br />
Washington — 62 — 6 — 18 — 9 — 3 33* 45 64* 55<br />
West Virginia 96* 92 2* 6 #* 1 1 1 # # 48* 57 50* 43<br />
Wisconsin 87* 75 7* 10 3* 9 2* 3 1 2 24* 38 71* 60<br />
Wyoming 90* 84 1* 2 6* 10 1 1 2 3 34 35 62 65<br />
Other jurisdictions<br />
District of Columbia 5* 7 91* 80 3* 11 1* 2 # # 79* 73 12* 26<br />
DoDEA 2 — 49 — 16 — 16 — 7 — 1 ‡ # ‡ #<br />
— Not available. The state/jurisdiction did not participate or did not meet the minimum participation guidelines for reporting.<br />
# Rounds to zero.<br />
‡ Reporting st<strong>and</strong>ards not met. Sample size insufficient to permit a reliable estimate.<br />
* Significantly different (p < .05) from <strong>2009</strong> when only one state/jurisdiction or the nation is being examined.<br />
1<br />
Accommodations were not permitted in this assessment year.<br />
2<br />
Department of Defense Education Activity (overseas <strong>and</strong> domestic schools).<br />
NOTE: Black includes <strong>African</strong> <strong>American</strong>, Hispanic includes Latino, <strong>and</strong> Pacific Isl<strong>and</strong>er includes Native Hawaiian. Race categories exclude Hispanic origin. Results are not shown for students whose race/ethnicity was unclassified <strong>and</strong><br />
for students whose eligibility status for free/reduced-price school lunch was not available. Data on eligibility for free/reduced-price school lunch were not collected until 1998.<br />
SOURCE: U.S. Department of Education, Institute of Education Sciences, National Center for Education Statistics, National Assessment of Educational Progress (NAEP), 1992, 1998, <strong>and</strong> <strong>2009</strong> <strong>Reading</strong> Assessments.<br />
52 THE NATION’S REPORT CARD