

Reading 2009 - African American Communication and Collaboration ...
Reading 2009 - African American Communication and Collaboration ...
Reading 2009 - African American Communication and Collaboration ...

Create successful ePaper yourself
Turn your PDF publications into a flip-book with our unique Google optimized e-Paper software.
GRADE<br />
4<br />
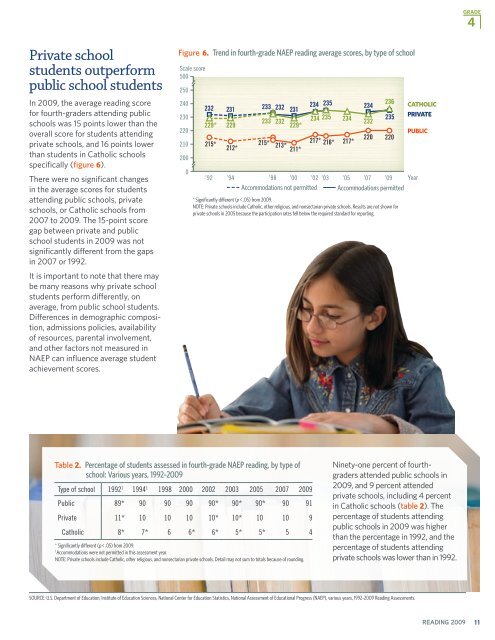
Private school<br />
students outperform<br />
public school students<br />
In <strong>2009</strong>, the average reading score<br />
for fourth-graders attending public<br />
schools was 15 points lower than the<br />
overall score for students attending<br />
private schools, <strong>and</strong> 16 points lower<br />
than students in Catholic schools<br />
specifically (figure 6).<br />
There were no significant changes<br />
in the average scores for students<br />
attending public schools, private<br />
schools, or Catholic schools from<br />
2007 to <strong>2009</strong>. The 15-point score<br />
gap between private <strong>and</strong> public<br />
school students in <strong>2009</strong> was not<br />
significantly different from the gaps<br />
in 2007 or 1992.<br />
It is important to note that there may<br />
be many reasons why private school<br />
students perform differently, on<br />
average, from public school students.<br />
Differences in demographic composition,<br />
admissions policies, availability<br />
of resources, parental involvement,<br />
<strong>and</strong> other factors not measured in<br />
NAEP can influence average student<br />
achievement scores.<br />
Figure 6. Trend in fourth-grade NAEP reading average scores, by type of school<br />
Scale score<br />
500<br />
250<br />
240<br />
230<br />
220<br />
210<br />
200<br />
0<br />
235<br />
232 231 233 232<br />
234<br />
234<br />
231<br />
233 232<br />
234 235 234<br />
232<br />
229* 229<br />
229*<br />
215* 215*<br />
212*<br />
213*<br />
211*<br />
217* 216*<br />
217*<br />
* Significantly different (p < .05) from <strong>2009</strong>.<br />
NOTE: Private schools include Catholic, other religious, <strong>and</strong> nonsectarian private schools. Results are not shown for<br />
private schools in 2005 because the participation rates fell below the required st<strong>and</strong>ard for reporting.<br />
220<br />
236<br />
235<br />
220<br />
CATHOLIC<br />
PRIVATE<br />
PUBLIC<br />
’92 ’94 ’98 ’00 ’02 ’03 ’05 ’07 ’09 Year<br />
Accommodations not permitted Accommodations permitted<br />
Table 2. Percentage of students assessed in fourth-grade NAEP reading, by type of<br />
school: Various years, 1992–<strong>2009</strong><br />
Type of school 1992 1 1994 1 1998 2000 2002 2003 2005 2007 <strong>2009</strong><br />
Public 89* 90 90 90 90* 90* 90* 90 91<br />
Private 11* 10 10 10 10* 10* 10 10 9<br />
Catholic 8* 7* 6 6* 6* 5* 5* 5 4<br />
* Significantly different (p < .05) from <strong>2009</strong>.<br />
1<br />
Accommodations were not permitted in this assessment year.<br />
NOTE: Private schools include Catholic, other religious, <strong>and</strong> nonsectarian private schools. Detail may not sum to totals because of rounding.<br />
Ninety-one percent of fourthgraders<br />
attended public schools in<br />
<strong>2009</strong>, <strong>and</strong> 9 percent attended<br />
private schools, including 4 percent<br />
in Catholic schools (table 2). The<br />
percentage of students attending<br />
public schools in <strong>2009</strong> was higher<br />
than the percentage in 1992, <strong>and</strong> the<br />
percentage of students attending<br />
private schools was lower than in 1992.<br />
SOURCE: U.S. Department of Education, Institute of Education Sciences, National Center for Education Statistics, National Assessment of Educational Progress (NAEP), various years, 1992–<strong>2009</strong> <strong>Reading</strong> Assessments.<br />
READING <strong>2009</strong><br />
11