

Reading 2009 - African American Communication and Collaboration ...
Reading 2009 - African American Communication and Collaboration ...
Reading 2009 - African American Communication and Collaboration ...

Create successful ePaper yourself
Turn your PDF publications into a flip-book with our unique Google optimized e-Paper software.
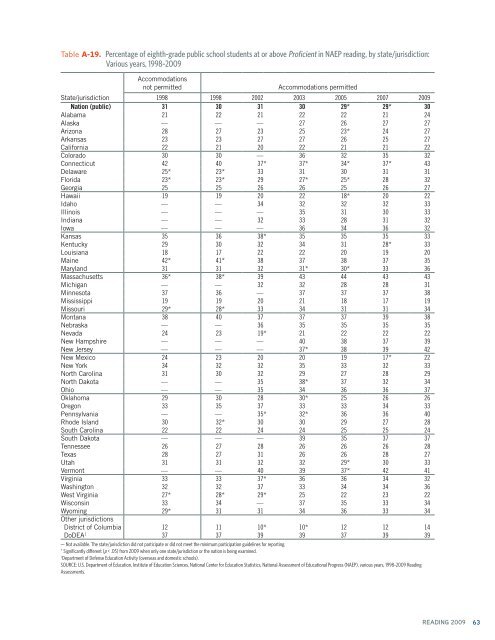
Table A-19. Percentage of eighth-grade public school students at or above Proficient in NAEP reading, by state/jurisdiction:<br />
Various years, 1998–<strong>2009</strong><br />
Accommodations<br />
not permitted<br />
Accommodations permitted<br />
State/jurisdiction 1998 1998 2002 2003 2005 2007 <strong>2009</strong><br />
Nation (public) 31 30 31 30 29* 29* 30<br />
Alabama 21 22 21 22 22 21 24<br />
Alaska — — — 27 26 27 27<br />
Arizona 28 27 23 25 23* 24 27<br />
Arkansas 23 23 27 27 26 25 27<br />
California 22 21 20 22 21 21 22<br />
Colorado 30 30 — 36 32 35 32<br />
Connecticut 42 40 37* 37* 34* 37* 43<br />
Delaware 25* 23* 33 31 30 31 31<br />
Florida 23* 23* 29 27* 25* 28 32<br />
Georgia 25 25 26 26 25 26 27<br />
Hawaii 19 19 20 22 18* 20 22<br />
Idaho — — 34 32 32 32 33<br />
Illinois — — — 35 31 30 33<br />
Indiana — — 32 33 28 31 32<br />
Iowa — — — 36 34 36 32<br />
Kansas 35 36 38* 35 35 35 33<br />
Kentucky 29 30 32 34 31 28* 33<br />
Louisiana 18 17 22 22 20 19 20<br />
Maine 42* 41* 38 37 38 37 35<br />
Maryl<strong>and</strong> 31 31 32 31* 30* 33 36<br />
Massachusetts 36* 38* 39 43 44 43 43<br />
Michigan — — 32 32 28 28 31<br />
Minnesota 37 36 — 37 37 37 38<br />
Mississippi 19 19 20 21 18 17 19<br />
Missouri 29* 28* 33 34 31 31 34<br />
Montana 38 40 37 37 37 39 38<br />
Nebraska — — 36 35 35 35 35<br />
Nevada 24 23 19* 21 22 22 22<br />
New Hampshire — — — 40 38 37 39<br />
New Jersey — — — 37* 38 39 42<br />
New Mexico 24 23 20 20 19 17* 22<br />
New York 34 32 32 35 33 32 33<br />
North Carolina 31 30 32 29 27 28 29<br />
North Dakota — — 35 38* 37 32 34<br />
Ohio — — 35 34 36 36 37<br />
Oklahoma 29 30 28 30* 25 26 26<br />
Oregon 33 35 37 33 33 34 33<br />
Pennsylvania — — 35* 32* 36 36 40<br />
Rhode Isl<strong>and</strong> 30 32* 30 30 29 27 28<br />
South Carolina 22 22 24 24 25 25 24<br />
South Dakota — — — 39 35 37 37<br />
Tennessee 26 27 28 26 26 26 28<br />
Texas 28 27 31 26 26 28 27<br />
Utah 31 31 32 32 29* 30 33<br />
Vermont — — 40 39 37* 42 41<br />
Virginia 33 33 37* 36 36 34 32<br />
Washington 32 32 37 33 34 34 36<br />
West Virginia 27* 28* 29* 25 22 23 22<br />
Wisconsin 33 34 — 37 35 33 34<br />
Wyoming 29* 31 31 34 36 33 34<br />
Other jurisdictions<br />
District of Columbia 12 11 10* 10* 12 12 14<br />
DoDEA 1 37 37 39 39 37 39 39<br />
— Not available. The state/jurisdiction did not participate or did not meet the minimum participation guidelines for reporting.<br />
* Significantly different (p < .05) from <strong>2009</strong> when only one state/jurisdiction or the nation is being examined.<br />
1<br />
Department of Defense Education Activity (overseas <strong>and</strong> domestic schools).<br />
SOURCE: U.S. Department of Education, Institute of Education Sciences, National Center for Education Statistics, National Assessment of Educational Progress (NAEP), various years, 1998–<strong>2009</strong> <strong>Reading</strong><br />
Assessments.<br />
READING <strong>2009</strong><br />
63