

Reading 2009 - African American Communication and Collaboration ...
Reading 2009 - African American Communication and Collaboration ...
Reading 2009 - African American Communication and Collaboration ...

You also want an ePaper? Increase the reach of your titles
YUMPU automatically turns print PDFs into web optimized ePapers that Google loves.
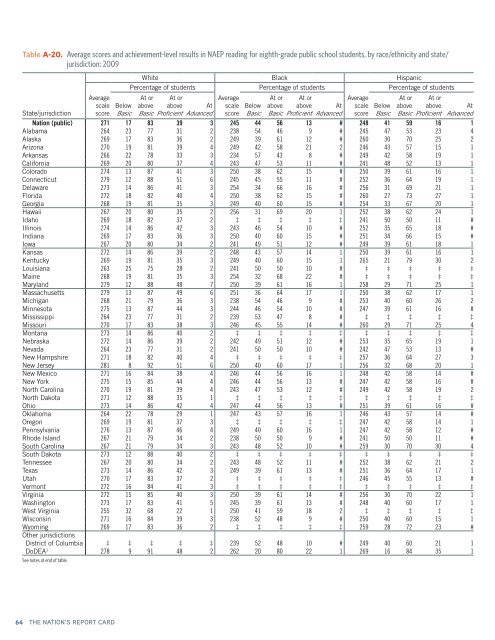
Table A-20. Average scores <strong>and</strong> achievement-level results in NAEP reading for eighth-grade public school students, by race/ethnicity <strong>and</strong> state/<br />
jurisdiction: <strong>2009</strong><br />
State/jurisdiction<br />
Average<br />
scale<br />
score<br />
Below<br />
Basic<br />
White Black Hispanic<br />
Percentage of students Percentage of students Percentage of students<br />
At or<br />
above<br />
Basic<br />
At or<br />
above<br />
Proficient<br />
At<br />
Advanced<br />
Average<br />
scale<br />
score<br />
Below<br />
Basic<br />
At or<br />
above<br />
Basic<br />
At or<br />
above<br />
Proficient<br />
At<br />
Advanced<br />
Average<br />
scale<br />
score<br />
Below<br />
Basic<br />
At or<br />
above<br />
Basic<br />
At or<br />
above<br />
Proficient<br />
At<br />
Advanced<br />
Nation (public) 271 17 83 39 3 245 44 56 13 # 248 41 59 16 1<br />
Alabama 264 23 77 31 2 238 54 46 9 # 245 47 53 23 4<br />
Alaska 269 17 83 36 2 249 39 61 12 # 260 30 70 25 2<br />
Arizona 270 19 81 39 4 249 42 58 21 2 246 43 57 15 1<br />
Arkansas 266 22 78 33 3 234 57 43 8 # 249 42 58 19 1<br />
California 269 20 80 37 4 243 47 53 11 # 241 48 52 13 1<br />
Colorado 274 13 87 41 3 250 38 62 15 # 250 39 61 16 1<br />
Connecticut 279 12 88 51 6 245 45 55 11 # 252 36 64 19 1<br />
Delaware 273 14 86 41 3 254 34 66 16 # 256 31 69 21 1<br />
Florida 272 18 82 40 4 250 38 62 15 # 260 27 73 27 1<br />
Georgia 268 19 81 35 3 249 40 60 15 # 254 33 67 20 1<br />
Hawaii 267 20 80 35 2 256 31 69 20 1 252 38 62 24 1<br />
Idaho 269 18 82 37 2 ‡ ‡ ‡ ‡ ‡ 241 50 50 11 #<br />
Illinois 274 14 86 42 3 243 46 54 10 # 252 35 65 18 #<br />
Indiana 269 17 83 36 3 250 40 60 15 # 251 34 66 15 #<br />
Iowa 267 20 80 34 2 241 49 51 12 # 249 39 61 18 1<br />
Kansas 272 14 86 39 2 248 43 57 14 1 250 39 61 16 1<br />
Kentucky 269 19 81 35 3 249 40 60 15 1 265 21 79 30 2<br />
Louisiana 263 25 75 28 2 241 50 50 10 # ‡ ‡ ‡ ‡ ‡<br />
Maine 268 19 81 35 3 254 32 68 22 # ‡ ‡ ‡ ‡ ‡<br />
Maryl<strong>and</strong> 279 12 88 48 7 250 39 61 16 1 258 29 71 25 1<br />
Massachusetts 279 13 87 49 6 251 36 64 17 1 250 38 62 17 1<br />
Michigan 268 21 79 36 3 238 54 46 9 # 253 40 60 26 2<br />
Minnesota 275 13 87 44 3 244 46 54 10 # 247 39 61 16 #<br />
Mississippi 264 23 77 31 2 239 53 47 8 # ‡ ‡ ‡ ‡ ‡<br />
Missouri 270 17 83 38 3 246 45 55 14 # 260 29 71 25 4<br />
Montana 273 14 86 40 2 ‡ ‡ ‡ ‡ ‡ ‡ ‡ ‡ ‡ ‡<br />
Nebraska 272 14 86 39 2 242 49 51 12 # 253 35 65 19 1<br />
Nevada 264 23 77 31 2 241 50 50 10 # 242 47 53 13 #<br />
New Hampshire 271 18 82 40 4 ‡ ‡ ‡ ‡ ‡ 257 36 64 27 3<br />
New Jersey 281 8 92 51 6 250 40 60 17 1 256 32 68 20 1<br />
New Mexico 271 16 84 38 4 246 44 56 16 1 248 42 58 14 #<br />
New York 275 15 85 44 4 246 44 56 13 # 247 42 58 16 #<br />
North Carolina 270 19 81 39 4 243 47 53 12 # 249 42 58 19 2<br />
North Dakota 271 12 88 35 1 ‡ ‡ ‡ ‡ ‡ ‡ ‡ ‡ ‡ ‡<br />
Ohio 273 14 86 42 4 247 44 56 13 # 251 39 61 16 #<br />
Oklahoma 264 22 78 29 1 247 43 57 16 1 246 43 57 14 #<br />
Oregon 269 19 81 37 3 ‡ ‡ ‡ ‡ ‡ 247 42 58 14 1<br />
Pennsylvania 276 13 87 46 4 249 40 60 16 1 247 42 58 12 #<br />
Rhode Isl<strong>and</strong> 267 21 79 34 2 238 50 50 9 # 241 50 50 11 #<br />
South Carolina 267 21 79 34 3 243 48 52 10 # 259 30 70 30 4<br />
South Dakota 273 12 88 40 2 ‡ ‡ ‡ ‡ ‡ ‡ ‡ ‡ ‡ ‡<br />
Tennessee 267 20 80 34 2 243 48 52 11 # 252 38 62 21 2<br />
Texas 273 14 86 42 3 249 39 61 13 # 251 36 64 17 1<br />
Utah 270 17 83 37 2 ‡ ‡ ‡ ‡ ‡ 246 45 55 13 #<br />
Vermont 272 16 84 41 3 ‡ ‡ ‡ ‡ ‡ ‡ ‡ ‡ ‡ ‡<br />
Virginia 272 15 85 40 3 250 39 61 14 # 256 30 70 22 1<br />
Washington 273 17 83 41 5 245 39 61 13 # 248 40 60 17 1<br />
West Virginia 255 32 68 22 1 250 41 59 18 2 ‡ ‡ ‡ ‡ ‡<br />
Wisconsin 271 16 84 39 3 238 52 48 9 # 250 40 60 15 1<br />
Wyoming 269 17 83 36 2 ‡ ‡ ‡ ‡ ‡ 259 28 72 23 #<br />
Other jurisdictions<br />
District of Columbia ‡ ‡ ‡ ‡ ‡ 239 52 48 10 # 249 40 60 21 1<br />
DoDEA 1 278 9 91 48 2 262 20 80 22 1 269 16 84 35 1<br />
See notes at end of table.<br />
64 THE NATION’S REPORT CARD