

Reading 2009 - African American Communication and Collaboration ...
Reading 2009 - African American Communication and Collaboration ...
Reading 2009 - African American Communication and Collaboration ...

You also want an ePaper? Increase the reach of your titles
YUMPU automatically turns print PDFs into web optimized ePapers that Google loves.
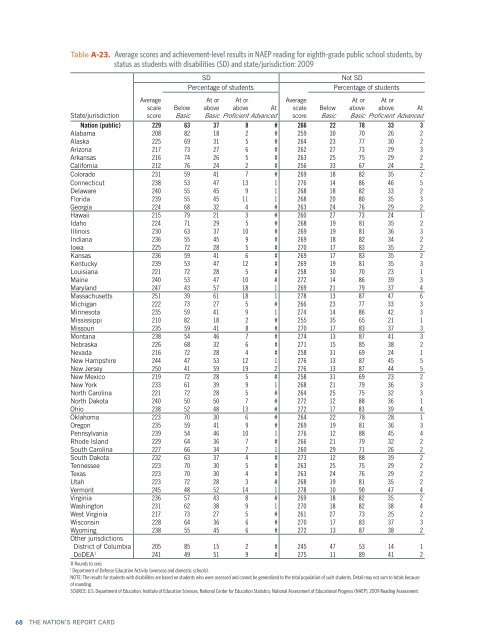
Table A-23. Average scores <strong>and</strong> achievement-level results in NAEP reading for eighth-grade public school students, by<br />
status as students with disabilities (SD) <strong>and</strong> state/jurisdiction: <strong>2009</strong><br />
State/jurisdiction<br />
Average<br />
scale<br />
score<br />
Below<br />
Basic<br />
SD<br />
Percentage of students<br />
At or<br />
above<br />
At or<br />
above At<br />
Basic Proficient Advanced<br />
Average<br />
scale<br />
score<br />
Below<br />
Basic<br />
Not SD<br />
Percentage of students<br />
At or<br />
above<br />
At or<br />
above At<br />
Basic Proficient Advanced<br />
Nation (public) 229 63 37 8 # 266 22 78 33 3<br />
Alabama 208 82 18 2 # 259 30 70 26 2<br />
Alaska 225 69 31 5 # 264 23 77 30 2<br />
Arizona 217 73 27 6 # 262 27 73 29 3<br />
Arkansas 216 74 26 5 # 263 25 75 29 2<br />
California 212 76 24 2 # 256 33 67 24 2<br />
Colorado 231 59 41 7 # 269 18 82 35 2<br />
Connecticut 238 53 47 13 1 276 14 86 46 5<br />
Delaware 240 55 45 9 1 268 18 82 33 2<br />
Florida 239 55 45 11 1 268 20 80 35 3<br />
Georgia 224 68 32 4 # 263 24 76 29 2<br />
Hawaii 215 79 21 3 # 260 27 73 24 1<br />
Idaho 224 71 29 5 # 268 19 81 35 2<br />
Illinois 230 63 37 10 # 269 19 81 36 3<br />
Indiana 236 55 45 9 # 269 18 82 34 2<br />
Iowa 225 72 28 5 # 270 17 83 35 2<br />
Kansas 236 59 41 6 # 269 17 83 35 2<br />
Kentucky 239 53 47 12 # 269 19 81 35 3<br />
Louisiana 221 72 28 5 # 258 30 70 23 1<br />
Maine 240 53 47 10 # 272 14 86 39 3<br />
Maryl<strong>and</strong> 247 43 57 18 1 269 21 79 37 4<br />
Massachusetts 251 39 61 18 1 278 13 87 47 6<br />
Michigan 222 73 27 5 # 266 23 77 33 3<br />
Minnesota 235 59 41 9 1 274 14 86 42 3<br />
Mississippi 210 82 18 2 # 255 35 65 21 1<br />
Missouri 235 59 41 8 # 270 17 83 37 3<br />
Montana 238 54 46 7 # 274 13 87 41 3<br />
Nebraska 226 68 32 6 # 271 15 85 38 2<br />
Nevada 216 72 28 4 # 258 31 69 24 1<br />
New Hampshire 244 47 53 12 1 276 13 87 45 5<br />
New Jersey 250 41 59 19 2 276 13 87 44 5<br />
New Mexico 219 72 28 5 # 258 31 69 23 2<br />
New York 233 61 39 9 1 268 21 79 36 3<br />
North Carolina 221 72 28 5 # 264 25 75 32 3<br />
North Dakota 240 50 50 7 # 272 12 88 36 1<br />
Ohio 238 52 48 13 # 272 17 83 39 4<br />
Oklahoma 223 70 30 6 # 264 22 78 28 1<br />
Oregon 235 59 41 9 # 269 19 81 36 3<br />
Pennsylvania 239 54 46 10 1 276 12 88 45 4<br />
Rhode Isl<strong>and</strong> 229 64 36 7 # 266 21 79 32 2<br />
South Carolina 227 66 34 7 1 260 29 71 26 2<br />
South Dakota 232 63 37 4 # 273 12 88 39 2<br />
Tennessee 223 70 30 5 # 263 25 75 29 2<br />
Texas 223 70 30 4 # 263 24 76 29 2<br />
Utah 223 72 28 3 # 268 19 81 35 2<br />
Vermont 245 48 52 14 1 278 10 90 47 4<br />
Virginia 236 57 43 8 # 269 18 82 35 2<br />
Washington 231 62 38 9 1 270 18 82 38 4<br />
West Virginia 217 73 27 5 # 261 27 73 25 2<br />
Wisconsin 228 64 36 6 # 270 17 83 37 3<br />
Wyoming 238 55 45 6 # 272 13 87 38 2<br />
Other jurisdictions<br />
District of Columbia 205 85 15 2 # 245 47 53 14 1<br />
DoDEA 1 241 49 51 9 # 275 11 89 41 2<br />
# Rounds to zero.<br />
1<br />
Department of Defense Education Activity (overseas <strong>and</strong> domestic schools).<br />
NOTE: The results for students with disabilities are based on students who were assessed <strong>and</strong> cannot be generalized to the total population of such students. Detail may not sum to totals because<br />
of rounding.<br />
SOURCE: U.S. Department of Education, Institute of Education Sciences, National Center for Education Statistics, National Assessment of Educational Progress (NAEP), <strong>2009</strong> <strong>Reading</strong> Assessment.<br />
68 THE NATION’S REPORT CARD