

Reading 2009 - African American Communication and Collaboration ...
Reading 2009 - African American Communication and Collaboration ...
Reading 2009 - African American Communication and Collaboration ...

You also want an ePaper? Increase the reach of your titles
YUMPU automatically turns print PDFs into web optimized ePapers that Google loves.
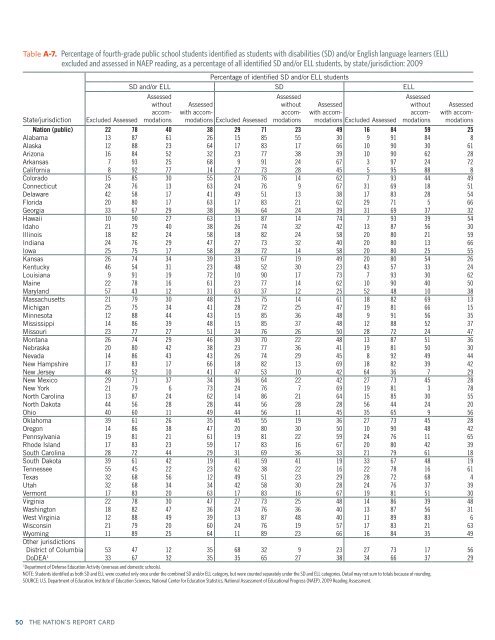
Table A-7. Percentage of fourth-grade public school students identified as students with disabilities (SD) <strong>and</strong>/or English language learners (ELL)<br />
excluded <strong>and</strong> assessed in NAEP reading, as a percentage of all identified SD <strong>and</strong>/or ELL students, by state/jurisdiction: <strong>2009</strong><br />
State/jurisdiction<br />
Excluded Assessed<br />
Percentage of identified SD <strong>and</strong>/or ELL students<br />
SD <strong>and</strong>/or ELL SD ELL<br />
Assessed<br />
without<br />
accommodations<br />
Assessed<br />
with accommodations<br />
Excluded Assessed<br />
Assessed<br />
without<br />
accommodations<br />
Assessed<br />
with accommodations<br />
Excluded Assessed<br />
Assessed<br />
without<br />
accommodations<br />
Assessed<br />
with accommodations<br />
Nation (public) 22 78 40 38 29 71 23 49 16 84 59 25<br />
Alabama 13 87 61 26 15 85 55 30 9 91 84 8<br />
Alaska 12 88 23 64 17 83 17 66 10 90 30 61<br />
Arizona 16 84 52 32 23 77 38 39 10 90 62 28<br />
Arkansas 7 93 25 68 9 91 24 67 3 97 24 72<br />
California 8 92 77 14 27 73 28 45 5 95 88 8<br />
Colorado 15 85 30 55 24 76 14 62 7 93 44 49<br />
Connecticut 24 76 13 63 24 76 9 67 31 69 18 51<br />
Delaware 42 58 17 41 49 51 13 38 17 83 28 54<br />
Florida 20 80 17 63 17 83 21 62 29 71 5 66<br />
Georgia 33 67 29 38 36 64 24 39 31 69 37 32<br />
Hawaii 10 90 27 63 13 87 14 74 7 93 39 54<br />
Idaho 21 79 40 38 26 74 32 42 13 87 56 30<br />
Illinois 18 82 24 58 18 82 24 58 20 80 21 59<br />
Indiana 24 76 29 47 27 73 32 40 20 80 13 66<br />
Iowa 25 75 17 58 28 72 14 58 20 80 25 55<br />
Kansas 26 74 34 39 33 67 19 49 20 80 54 26<br />
Kentucky 46 54 31 23 48 52 30 23 43 57 33 24<br />
Louisiana 9 91 19 72 10 90 17 73 7 93 30 62<br />
Maine 22 78 16 61 23 77 14 62 10 90 40 50<br />
Maryl<strong>and</strong> 57 43 12 31 63 37 12 25 52 48 10 38<br />
Massachusetts 21 79 30 48 25 75 14 61 18 82 69 13<br />
Michigan 25 75 34 41 28 72 25 47 19 81 66 15<br />
Minnesota 12 88 44 43 15 85 36 48 9 91 56 35<br />
Mississippi 14 86 39 48 15 85 37 48 12 88 52 37<br />
Missouri 23 77 27 51 24 76 26 50 28 72 24 47<br />
Montana 26 74 29 46 30 70 22 48 13 87 51 36<br />
Nebraska 20 80 42 38 23 77 36 41 19 81 50 30<br />
Nevada 14 86 43 43 26 74 29 45 8 92 49 44<br />
New Hampshire 17 83 17 66 18 82 13 69 18 82 39 42<br />
New Jersey 48 52 10 41 47 53 10 42 64 36 7 29<br />
New Mexico 29 71 37 34 36 64 22 42 27 73 45 28<br />
New York 21 79 6 73 24 76 7 69 19 81 3 78<br />
North Carolina 13 87 24 62 14 86 21 64 15 85 30 55<br />
North Dakota 44 56 28 28 44 56 28 28 56 44 24 20<br />
Ohio 40 60 11 49 44 56 11 45 35 65 9 56<br />
Oklahoma 39 61 26 35 45 55 19 36 27 73 45 28<br />
Oregon 14 86 38 47 20 80 30 50 10 90 48 42<br />
Pennsylvania 19 81 21 61 19 81 22 59 24 76 11 65<br />
Rhode Isl<strong>and</strong> 17 83 23 59 17 83 16 67 20 80 42 39<br />
South Carolina 28 72 44 29 31 69 36 33 21 79 61 18<br />
South Dakota 39 61 42 19 41 59 41 19 33 67 48 19<br />
Tennessee 55 45 22 23 62 38 22 16 22 78 16 61<br />
Texas 32 68 56 12 49 51 23 29 28 72 68 4<br />
Utah 32 68 34 34 42 58 30 28 24 76 37 39<br />
Vermont 17 83 20 63 17 83 16 67 19 81 51 30<br />
Virginia 22 78 30 47 27 73 25 48 14 86 39 48<br />
Washington 18 82 47 36 24 76 36 40 13 87 56 31<br />
West Virginia 12 88 49 39 13 87 48 40 11 89 83 6<br />
Wisconsin 21 79 20 60 24 76 19 57 17 83 21 63<br />
Wyoming 11 89 25 64 11 89 23 66 16 84 35 49<br />
Other jurisdictions<br />
District of Columbia 53 47 12 35 68 32 9 23 27 73 17 56<br />
DoDEA 1 33 67 32 35 35 65 27 38 34 66 37 29<br />
1<br />
Department of Defense Education Activity (overseas <strong>and</strong> domestic schools).<br />
NOTE: Students identified as both SD <strong>and</strong> ELL were counted only once under the combined SD <strong>and</strong>/or ELL category, but were counted separately under the SD <strong>and</strong> ELL categories. Detail may not sum to totals because of rounding.<br />
SOURCE: U.S. Department of Education, Institute of Education Sciences, National Center for Education Statistics, National Assessment of Educational Progress (NAEP), <strong>2009</strong> <strong>Reading</strong> Assessment.<br />
50 THE NATION’S REPORT CARD