

Reading 2009 - African American Communication and Collaboration ...
Reading 2009 - African American Communication and Collaboration ...
Reading 2009 - African American Communication and Collaboration ...

Create successful ePaper yourself
Turn your PDF publications into a flip-book with our unique Google optimized e-Paper software.
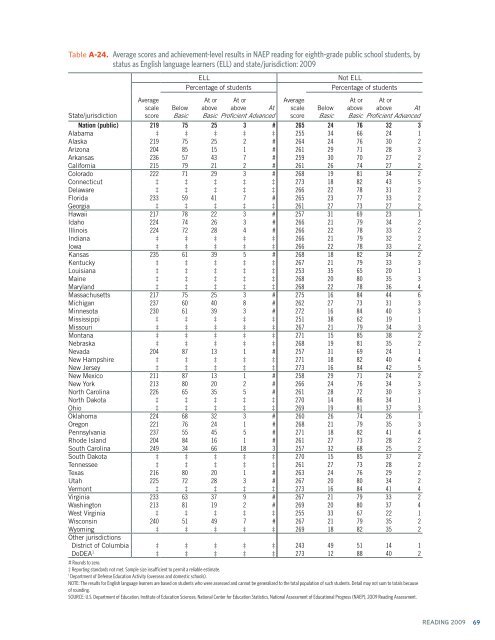
Table A-24. Average scores <strong>and</strong> achievement-level results in NAEP reading for eighth-grade public school students, by<br />
status as English language learners (ELL) <strong>and</strong> state/jurisdiction: <strong>2009</strong><br />
State/jurisdiction<br />
Average<br />
scale<br />
score<br />
Below<br />
Basic<br />
ELL<br />
Percentage of students<br />
At or<br />
above<br />
At or<br />
above At<br />
Basic Proficient Advanced<br />
Average<br />
scale<br />
score<br />
Below<br />
Basic<br />
Not ELL<br />
Percentage of students<br />
At or<br />
above<br />
At or<br />
above At<br />
Basic Proficient Advanced<br />
Nation (public) 219 75 25 3 # 265 24 76 32 3<br />
Alabama ‡ ‡ ‡ ‡ ‡ 255 34 66 24 1<br />
Alaska 219 75 25 2 # 264 24 76 30 2<br />
Arizona 204 85 15 1 # 261 29 71 28 3<br />
Arkansas 236 57 43 7 # 259 30 70 27 2<br />
California 215 79 21 2 # 261 26 74 27 2<br />
Colorado 222 71 29 3 # 268 19 81 34 2<br />
Connecticut ‡ ‡ ‡ ‡ ‡ 273 18 82 43 5<br />
Delaware ‡ ‡ ‡ ‡ ‡ 266 22 78 31 2<br />
Florida 233 59 41 7 # 265 23 77 33 2<br />
Georgia ‡ ‡ ‡ ‡ ‡ 261 27 73 27 2<br />
Hawaii 217 78 22 3 # 257 31 69 23 1<br />
Idaho 224 74 26 3 # 266 21 79 34 2<br />
Illinois 224 72 28 4 # 266 22 78 33 2<br />
Indiana ‡ ‡ ‡ ‡ ‡ 266 21 79 32 2<br />
Iowa ‡ ‡ ‡ ‡ ‡ 266 22 78 33 2<br />
Kansas 235 61 39 5 # 268 18 82 34 2<br />
Kentucky ‡ ‡ ‡ ‡ ‡ 267 21 79 33 3<br />
Louisiana ‡ ‡ ‡ ‡ ‡ 253 35 65 20 1<br />
Maine ‡ ‡ ‡ ‡ ‡ 268 20 80 35 3<br />
Maryl<strong>and</strong> ‡ ‡ ‡ ‡ ‡ 268 22 78 36 4<br />
Massachusetts 217 75 25 3 # 275 16 84 44 6<br />
Michigan 237 60 40 8 # 262 27 73 31 3<br />
Minnesota 230 61 39 3 # 272 16 84 40 3<br />
Mississippi ‡ ‡ ‡ ‡ ‡ 251 38 62 19 1<br />
Missouri ‡ ‡ ‡ ‡ ‡ 267 21 79 34 3<br />
Montana ‡ ‡ ‡ ‡ ‡ 271 15 85 38 2<br />
Nebraska ‡ ‡ ‡ ‡ ‡ 268 19 81 35 2<br />
Nevada 204 87 13 1 # 257 31 69 24 1<br />
New Hampshire ‡ ‡ ‡ ‡ ‡ 271 18 82 40 4<br />
New Jersey ‡ ‡ ‡ ‡ ‡ 273 16 84 42 5<br />
New Mexico 211 87 13 1 # 258 29 71 24 2<br />
New York 213 80 20 2 # 266 24 76 34 3<br />
North Carolina 226 65 35 5 # 261 28 72 30 3<br />
North Dakota ‡ ‡ ‡ ‡ ‡ 270 14 86 34 1<br />
Ohio ‡ ‡ ‡ ‡ ‡ 269 19 81 37 3<br />
Oklahoma 224 68 32 3 # 260 26 74 26 1<br />
Oregon 221 76 24 1 # 268 21 79 35 3<br />
Pennsylvania 237 55 45 5 # 271 18 82 41 4<br />
Rhode Isl<strong>and</strong> 204 84 16 1 # 261 27 73 28 2<br />
South Carolina 249 34 66 18 3 257 32 68 25 2<br />
South Dakota ‡ ‡ ‡ ‡ ‡ 270 15 85 37 2<br />
Tennessee ‡ ‡ ‡ ‡ ‡ 261 27 73 28 2<br />
Texas 216 80 20 1 # 263 24 76 29 2<br />
Utah 225 72 28 3 # 267 20 80 34 2<br />
Vermont ‡ ‡ ‡ ‡ ‡ 273 16 84 41 4<br />
Virginia 233 63 37 9 # 267 21 79 33 2<br />
Washington 213 81 19 2 # 269 20 80 37 4<br />
West Virginia ‡ ‡ ‡ ‡ ‡ 255 33 67 22 1<br />
Wisconsin 240 51 49 7 # 267 21 79 35 2<br />
Wyoming ‡ ‡ ‡ ‡ ‡ 269 18 82 35 2<br />
Other jurisdictions<br />
District of Columbia ‡ ‡ ‡ ‡ ‡ 243 49 51 14 1<br />
DoDEA 1 ‡ ‡ ‡ ‡ ‡ 273 12 88 40 2<br />
# Rounds to zero.<br />
‡ Reporting st<strong>and</strong>ards not met. Sample size insufficient to permit a reliable estimate.<br />
1<br />
Department of Defense Education Activity (overseas <strong>and</strong> domestic schools).<br />
NOTE: The results for English language learners are based on students who were assessed <strong>and</strong> cannot be generalized to the total population of such students. Detail may not sum to totals because<br />
of rounding.<br />
SOURCE: U.S. Department of Education, Institute of Education Sciences, National Center for Education Statistics, National Assessment of Educational Progress (NAEP), <strong>2009</strong> <strong>Reading</strong> Assessment.<br />
READING <strong>2009</strong><br />
69