

Reading 2009 - African American Communication and Collaboration ...
Reading 2009 - African American Communication and Collaboration ...
Reading 2009 - African American Communication and Collaboration ...

Create successful ePaper yourself
Turn your PDF publications into a flip-book with our unique Google optimized e-Paper software.
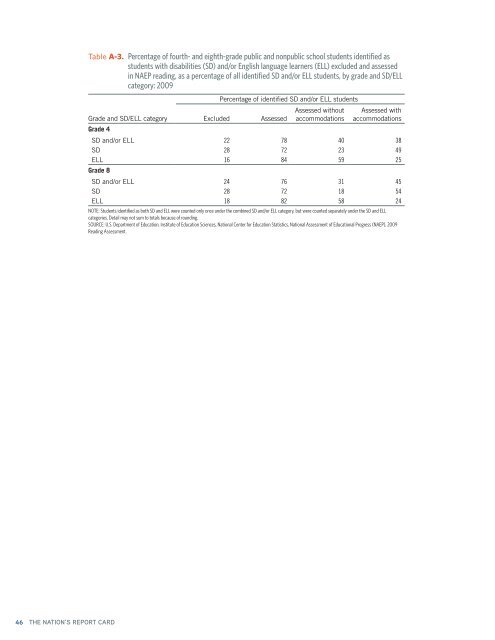
Table A-3. Percentage of fourth- <strong>and</strong> eighth-grade public <strong>and</strong> nonpublic school students identified as<br />
students with disabilities (SD) <strong>and</strong>/or English language learners (ELL) excluded <strong>and</strong> assessed<br />
in NAEP reading, as a percentage of all identified SD <strong>and</strong>/or ELL students, by grade <strong>and</strong> SD/ELL<br />
category: <strong>2009</strong><br />
Grade <strong>and</strong> SD/ELL category Excluded Assessed<br />
Grade 4<br />
Percentage of identified SD <strong>and</strong>/or ELL students<br />
Assessed without<br />
accommodations<br />
Assessed with<br />
accommodations<br />
SD <strong>and</strong>/or ELL 22 78 40 38<br />
SD 28 72 23 49<br />
ELL 16 84 59 25<br />
Grade 8<br />
SD <strong>and</strong>/or ELL 24 76 31 45<br />
SD 28 72 18 54<br />
ELL 18 82 58 24<br />
NOTE: Students identified as both SD <strong>and</strong> ELL were counted only once under the combined SD <strong>and</strong>/or ELL category, but were counted separately under the SD <strong>and</strong> ELL<br />
categories. Detail may not sum to totals because of rounding.<br />
SOURCE: U.S. Department of Education, Institute of Education Sciences, National Center for Education Statistics, National Assessment of Educational Progress (NAEP), <strong>2009</strong><br />
<strong>Reading</strong> Assessment.<br />
46 THE NATION’S REPORT CARD