

Reading 2009 - African American Communication and Collaboration ...
Reading 2009 - African American Communication and Collaboration ...
Reading 2009 - African American Communication and Collaboration ...

Create successful ePaper yourself
Turn your PDF publications into a flip-book with our unique Google optimized e-Paper software.
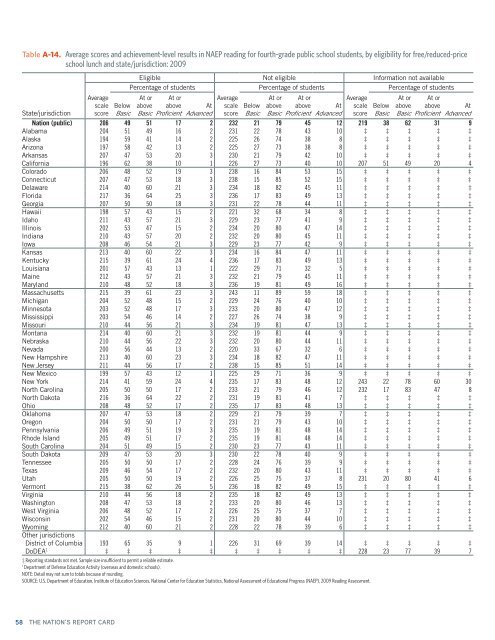
Table A-14. Average scores <strong>and</strong> achievement-level results in NAEP reading for fourth-grade public school students, by eligibility for free/reduced-price<br />
school lunch <strong>and</strong> state/jurisdiction: <strong>2009</strong><br />
State/jurisdiction<br />
Average<br />
scale<br />
score<br />
Below<br />
Basic<br />
Eligible Not eligible Information not available<br />
Percentage of students Percentage of students Percentage of students<br />
At or<br />
above<br />
Basic<br />
At or<br />
above<br />
Proficient<br />
At<br />
Advanced<br />
Average<br />
scale<br />
score<br />
Below<br />
Basic<br />
At or<br />
above<br />
Basic<br />
At or<br />
above<br />
Proficient<br />
At<br />
Advanced<br />
Average<br />
scale<br />
score<br />
Below<br />
Basic<br />
At or<br />
above<br />
Basic<br />
At or<br />
above<br />
Proficient<br />
At<br />
Advanced<br />
Nation (public) 206 49 51 17 2 232 21 79 45 12 219 38 62 31 9<br />
Alabama 204 51 49 16 2 231 22 78 43 10 ‡ ‡ ‡ ‡ ‡<br />
Alaska 194 59 41 14 2 225 26 74 38 8 ‡ ‡ ‡ ‡ ‡<br />
Arizona 197 58 42 13 2 225 27 73 38 8 ‡ ‡ ‡ ‡ ‡<br />
Arkansas 207 47 53 20 3 230 21 79 42 10 ‡ ‡ ‡ ‡ ‡<br />
California 196 62 38 10 1 226 27 73 40 10 207 51 49 20 4<br />
Colorado 206 48 52 19 3 238 16 84 53 15 ‡ ‡ ‡ ‡ ‡<br />
Connecticut 207 47 53 18 3 238 15 85 52 15 ‡ ‡ ‡ ‡ ‡<br />
Delaware 214 40 60 21 3 234 18 82 45 11 ‡ ‡ ‡ ‡ ‡<br />
Florida 217 36 64 25 3 236 17 83 49 13 ‡ ‡ ‡ ‡ ‡<br />
Georgia 207 50 50 18 3 231 22 78 44 11 ‡ ‡ ‡ ‡ ‡<br />
Hawaii 198 57 43 15 2 221 32 68 34 8 ‡ ‡ ‡ ‡ ‡<br />
Idaho 211 43 57 21 3 229 23 77 41 9 ‡ ‡ ‡ ‡ ‡<br />
Illinois 202 53 47 15 2 234 20 80 47 14 ‡ ‡ ‡ ‡ ‡<br />
Indiana 210 43 57 20 2 232 20 80 45 11 ‡ ‡ ‡ ‡ ‡<br />
Iowa 208 46 54 21 3 229 23 77 42 9 ‡ ‡ ‡ ‡ ‡<br />
Kansas 213 40 60 22 3 234 16 84 47 11 ‡ ‡ ‡ ‡ ‡<br />
Kentucky 215 39 61 24 4 236 17 83 49 13 ‡ ‡ ‡ ‡ ‡<br />
Louisiana 201 57 43 13 1 222 29 71 32 5 ‡ ‡ ‡ ‡ ‡<br />
Maine 212 43 57 21 3 232 21 79 45 11 ‡ ‡ ‡ ‡ ‡<br />
Maryl<strong>and</strong> 210 48 52 18 3 236 19 81 49 16 ‡ ‡ ‡ ‡ ‡<br />
Massachusetts 215 39 61 23 3 243 11 89 59 18 ‡ ‡ ‡ ‡ ‡<br />
Michigan 204 52 48 15 2 229 24 76 40 10 ‡ ‡ ‡ ‡ ‡<br />
Minnesota 203 52 48 17 3 233 20 80 47 12 ‡ ‡ ‡ ‡ ‡<br />
Mississippi 203 54 46 14 2 227 26 74 38 9 ‡ ‡ ‡ ‡ ‡<br />
Missouri 210 44 56 21 3 234 19 81 47 13 ‡ ‡ ‡ ‡ ‡<br />
Montana 214 40 60 21 3 232 19 81 44 9 ‡ ‡ ‡ ‡ ‡<br />
Nebraska 210 44 56 22 3 232 20 80 44 11 ‡ ‡ ‡ ‡ ‡<br />
Nevada 200 56 44 13 2 220 33 67 32 6 ‡ ‡ ‡ ‡ ‡<br />
New Hampshire 213 40 60 23 3 234 18 82 47 11 ‡ ‡ ‡ ‡ ‡<br />
New Jersey 211 44 56 17 2 238 15 85 51 14 ‡ ‡ ‡ ‡ ‡<br />
New Mexico 199 57 43 12 1 225 29 71 36 9 ‡ ‡ ‡ ‡ ‡<br />
New York 214 41 59 24 4 235 17 83 48 12 243 22 78 60 30<br />
North Carolina 205 50 50 17 2 233 21 79 46 12 232 17 83 47 8<br />
North Dakota 216 36 64 22 2 231 19 81 41 7 ‡ ‡ ‡ ‡ ‡<br />
Ohio 208 48 52 17 2 235 17 83 48 13 ‡ ‡ ‡ ‡ ‡<br />
Oklahoma 207 47 53 18 2 229 21 79 39 7 ‡ ‡ ‡ ‡ ‡<br />
Oregon 204 50 50 17 2 231 21 79 43 10 ‡ ‡ ‡ ‡ ‡<br />
Pennsylvania 206 49 51 19 3 235 19 81 48 14 ‡ ‡ ‡ ‡ ‡<br />
Rhode Isl<strong>and</strong> 205 49 51 17 2 235 19 81 48 14 ‡ ‡ ‡ ‡ ‡<br />
South Carolina 204 51 49 15 2 230 23 77 43 11 ‡ ‡ ‡ ‡ ‡<br />
South Dakota 209 47 53 20 3 230 22 78 40 9 ‡ ‡ ‡ ‡ ‡<br />
Tennessee 205 50 50 17 2 228 24 76 39 9 ‡ ‡ ‡ ‡ ‡<br />
Texas 209 46 54 17 2 232 20 80 43 11 ‡ ‡ ‡ ‡ ‡<br />
Utah 205 50 50 19 2 226 25 75 37 8 231 20 80 41 6<br />
Vermont 215 38 62 26 5 236 18 82 49 15 ‡ ‡ ‡ ‡ ‡<br />
Virginia 210 44 56 18 2 235 18 82 49 13 ‡ ‡ ‡ ‡ ‡<br />
Washington 208 47 53 18 2 233 20 80 46 13 ‡ ‡ ‡ ‡ ‡<br />
West Virginia 206 48 52 17 2 226 25 75 37 7 ‡ ‡ ‡ ‡ ‡<br />
Wisconsin 202 54 46 15 2 231 20 80 44 10 ‡ ‡ ‡ ‡ ‡<br />
Wyoming 212 40 60 21 2 228 22 78 39 6 ‡ ‡ ‡ ‡ ‡<br />
Other jurisdictions<br />
District of Columbia 193 65 35 9 1 226 31 69 39 14 ‡ ‡ ‡ ‡ ‡<br />
DoDEA 1 ‡ ‡ ‡ ‡ ‡ ‡ ‡ ‡ ‡ ‡ 228 23 77 39 7<br />
‡ Reporting st<strong>and</strong>ards not met. Sample size insufficient to permit a reliable estimate.<br />
1<br />
Department of Defense Education Activity (overseas <strong>and</strong> domestic schools).<br />
NOTE: Detail may not sum to totals because of rounding.<br />
SOURCE: U.S. Department of Education, Institute of Education Sciences, National Center for Education Statistics, National Assessment of Educational Progress (NAEP), <strong>2009</strong> <strong>Reading</strong> Assessment.<br />
58 THE NATION’S REPORT CARD