

Reading 2009 - African American Communication and Collaboration ...
Reading 2009 - African American Communication and Collaboration ...
Reading 2009 - African American Communication and Collaboration ...

Create successful ePaper yourself
Turn your PDF publications into a flip-book with our unique Google optimized e-Paper software.
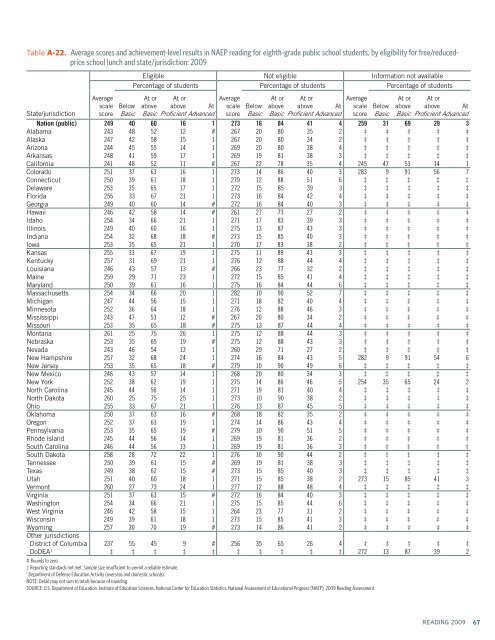
Table A-22. Average scores <strong>and</strong> achievement-level results in NAEP reading for eighth-grade public school students, by eligibility for free/reducedprice<br />
school lunch <strong>and</strong> state/jurisdiction: <strong>2009</strong><br />
State/jurisdiction<br />
Average<br />
scale<br />
score<br />
Below<br />
Basic<br />
Eligible Not eligible Information not available<br />
Percentage of students Percentage of students Percentage of students<br />
At or<br />
above<br />
Basic<br />
At or<br />
above<br />
Proficient<br />
At<br />
Advanced<br />
Average<br />
scale<br />
score<br />
Below<br />
Basic<br />
At or<br />
above<br />
Basic<br />
At or<br />
above<br />
Proficient<br />
At<br />
Advanced<br />
Average<br />
scale<br />
score<br />
Below<br />
Basic<br />
At or<br />
above<br />
Basic<br />
At or<br />
above<br />
Proficient<br />
At<br />
Advanced<br />
Nation (public) 249 40 60 16 1 273 16 84 41 4 259 31 69 29 3<br />
Alabama 243 48 52 12 # 267 20 80 35 2 ‡ ‡ ‡ ‡ ‡<br />
Alaska 247 42 58 15 1 267 20 80 34 2 ‡ ‡ ‡ ‡ ‡<br />
Arizona 244 45 55 14 1 269 20 80 38 4 ‡ ‡ ‡ ‡ ‡<br />
Arkansas 248 41 59 17 1 269 19 81 38 3 ‡ ‡ ‡ ‡ ‡<br />
California 241 48 52 11 # 267 22 78 35 4 245 47 53 14 1<br />
Colorado 251 37 63 16 1 273 14 86 40 3 283 9 91 56 7<br />
Connecticut 250 39 61 18 1 279 12 88 51 6 ‡ ‡ ‡ ‡ ‡<br />
Delaware 253 35 65 17 1 272 15 85 39 3 ‡ ‡ ‡ ‡ ‡<br />
Florida 255 33 67 21 1 273 16 84 42 4 ‡ ‡ ‡ ‡ ‡<br />
Georgia 249 40 60 14 # 272 16 84 40 3 ‡ ‡ ‡ ‡ ‡<br />
Hawaii 246 42 58 14 # 261 27 73 27 2 ‡ ‡ ‡ ‡ ‡<br />
Idaho 254 34 66 21 1 271 17 83 39 3 ‡ ‡ ‡ ‡ ‡<br />
Illinois 249 40 60 16 1 275 13 87 43 3 ‡ ‡ ‡ ‡ ‡<br />
Indiana 254 32 68 18 # 273 15 85 40 3 ‡ ‡ ‡ ‡ ‡<br />
Iowa 253 35 65 21 1 270 17 83 38 2 ‡ ‡ ‡ ‡ ‡<br />
Kansas 255 33 67 19 1 275 11 89 43 3 ‡ ‡ ‡ ‡ ‡<br />
Kentucky 257 31 69 21 1 276 12 88 44 4 ‡ ‡ ‡ ‡ ‡<br />
Louisiana 246 43 57 13 # 266 23 77 32 2 ‡ ‡ ‡ ‡ ‡<br />
Maine 259 29 71 23 1 272 15 85 41 4 ‡ ‡ ‡ ‡ ‡<br />
Maryl<strong>and</strong> 250 39 61 16 1 275 16 84 44 6 ‡ ‡ ‡ ‡ ‡<br />
Massachusetts 254 34 66 20 1 282 10 90 52 7 ‡ ‡ ‡ ‡ ‡<br />
Michigan 247 44 56 15 1 271 18 82 40 4 ‡ ‡ ‡ ‡ ‡<br />
Minnesota 252 36 64 18 1 276 12 88 46 3 ‡ ‡ ‡ ‡ ‡<br />
Mississippi 243 47 53 12 # 267 20 80 34 2 ‡ ‡ ‡ ‡ ‡<br />
Missouri 253 35 65 18 # 275 13 87 44 4 ‡ ‡ ‡ ‡ ‡<br />
Montana 261 25 75 26 1 275 12 88 44 3 ‡ ‡ ‡ ‡ ‡<br />
Nebraska 253 35 65 19 # 275 12 88 43 3 ‡ ‡ ‡ ‡ ‡<br />
Nevada 243 46 54 13 1 260 29 71 27 2 ‡ ‡ ‡ ‡ ‡<br />
New Hampshire 257 32 68 24 1 274 16 84 43 5 282 9 91 54 6<br />
New Jersey 253 35 65 18 # 279 10 90 49 6 ‡ ‡ ‡ ‡ ‡<br />
New Mexico 246 43 57 14 1 268 20 80 34 3 ‡ ‡ ‡ ‡ ‡<br />
New York 252 38 62 19 1 275 14 86 46 5 254 35 65 24 2<br />
North Carolina 245 44 56 14 1 271 19 81 40 4 ‡ ‡ ‡ ‡ ‡<br />
North Dakota 260 25 75 25 1 273 10 90 38 2 ‡ ‡ ‡ ‡ ‡<br />
Ohio 255 33 67 21 1 276 13 87 45 5 ‡ ‡ ‡ ‡ ‡<br />
Oklahoma 250 37 63 16 # 268 18 82 35 2 ‡ ‡ ‡ ‡ ‡<br />
Oregon 252 37 63 19 1 274 14 86 43 4 ‡ ‡ ‡ ‡ ‡<br />
Pennsylvania 253 35 65 19 # 279 10 90 51 5 ‡ ‡ ‡ ‡ ‡<br />
Rhode Isl<strong>and</strong> 245 44 56 14 1 269 19 81 36 2 ‡ ‡ ‡ ‡ ‡<br />
South Carolina 246 44 56 13 1 269 19 81 36 3 ‡ ‡ ‡ ‡ ‡<br />
South Dakota 258 28 72 22 1 276 10 90 44 2 ‡ ‡ ‡ ‡ ‡<br />
Tennessee 250 39 61 15 # 269 19 81 38 3 ‡ ‡ ‡ ‡ ‡<br />
Texas 249 38 62 15 # 273 15 85 40 3 ‡ ‡ ‡ ‡ ‡<br />
Utah 251 40 60 18 1 271 15 85 38 2 273 15 85 41 3<br />
Vermont 260 27 73 24 1 277 12 88 48 4 ‡ ‡ ‡ ‡ ‡<br />
Virginia 251 37 63 15 # 272 16 84 40 3 ‡ ‡ ‡ ‡ ‡<br />
Washington 254 34 66 21 1 275 15 85 44 6 ‡ ‡ ‡ ‡ ‡<br />
West Virginia 246 42 58 15 1 264 23 77 31 2 ‡ ‡ ‡ ‡ ‡<br />
Wisconsin 249 39 61 18 1 273 15 85 41 3 ‡ ‡ ‡ ‡ ‡<br />
Wyoming 257 30 70 19 # 273 14 86 41 2 ‡ ‡ ‡ ‡ ‡<br />
Other jurisdictions<br />
District of Columbia 237 55 45 9 # 256 35 65 26 4 ‡ ‡ ‡ ‡ ‡<br />
DoDEA 1 ‡ ‡ ‡ ‡ ‡ ‡ ‡ ‡ ‡ ‡ 272 13 87 39 2<br />
# Rounds to zero.<br />
‡ Reporting st<strong>and</strong>ards not met. Sample size insufficient to permit a reliable estimate.<br />
1<br />
Department of Defense Education Activity (overseas <strong>and</strong> domestic schools).<br />
NOTE: Detail may not sum to totals because of rounding.<br />
SOURCE: U.S. Department of Education, Institute of Education Sciences, National Center for Education Statistics, National Assessment of Educational Progress (NAEP), <strong>2009</strong> <strong>Reading</strong> Assessment.<br />
READING <strong>2009</strong><br />
67