tivity on the carmel faul
tivity on the carmel faul
tivity on the carmel faul

Create successful ePaper yourself
Turn your PDF publications into a flip-book with our unique Google optimized e-Paper software.
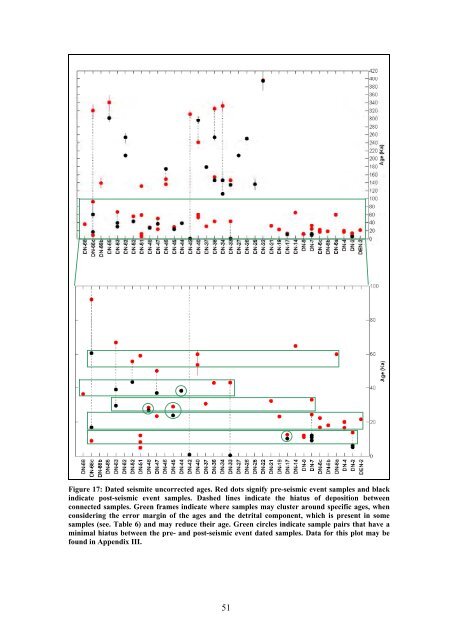
Figure 17: Dated seismite uncorrected ages. Red dots signify pre-seismic event samples and black<br />
indicate post-seismic event samples. Dashed lines indicate <strong>the</strong> hiatus of depositi<strong>on</strong> between<br />
c<strong>on</strong>nected samples. Green frames indicate where samples may cluster around specific ages, when<br />
c<strong>on</strong>sidering <strong>the</strong> error margin of <strong>the</strong> ages and <strong>the</strong> detrital comp<strong>on</strong>ent, which is present in some<br />
samples (see. Table 6) and may reduce <strong>the</strong>ir age. Green circles indicate sample pairs that have a<br />
minimal hiatus between <strong>the</strong> pre- and post-seismic event dated samples. Data for this plot may be<br />
found in Appendix III.<br />
51