SEC Form 17-A: Annual Report - the solid group inc website
SEC Form 17-A: Annual Report - the solid group inc website
SEC Form 17-A: Annual Report - the solid group inc website

Create successful ePaper yourself
Turn your PDF publications into a flip-book with our unique Google optimized e-Paper software.
- 35 -<br />
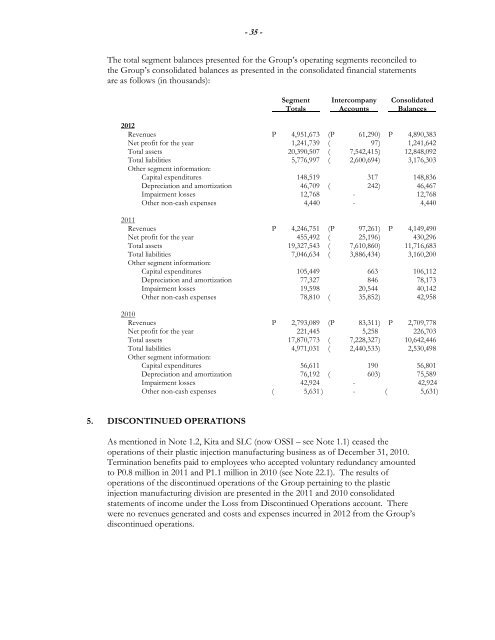
The total segment balances presented for <strong>the</strong> Group’s operating segments reconciled to<br />
<strong>the</strong> Group’s con<strong>solid</strong>ated balances as presented in <strong>the</strong> con<strong>solid</strong>ated financial statements<br />
are as follows (in thousands):<br />
Segment Intercompany Con<strong>solid</strong>ated<br />
Totals Accounts Balances<br />
2012<br />
Revenues P 4,951,673 (P 61,290 ) P 4,890,383<br />
Net profit for <strong>the</strong> year 1,241,739 ( 97 ) 1,241,642<br />
Total assets 20,390,507 ( 7,542,415 ) 12,848,092<br />
Total liabilities 5,776,997 ( 2,600,694) 3,<strong>17</strong>6,303<br />
O<strong>the</strong>r segment information:<br />
Capital expenditures 148,519 3<strong>17</strong> 148,836<br />
Depreciation and amortization 46,709 ( 242 ) 46,467<br />
Impairment losses 12,768 - 12,768<br />
O<strong>the</strong>r non-cash expenses 4,440 - 4,440<br />
2011<br />
Revenues P 4,246,751 (P 97,261 ) P 4,149,490<br />
Net profit for <strong>the</strong> year 455,492 ( 25,196 ) 430,296<br />
Total assets 19,327,543 ( 7,610,860 ) 11,716,683<br />
Total liabilities 7,046,634 ( 3,886,434) 3,160,200<br />
O<strong>the</strong>r segment information:<br />
Capital expenditures 105,449 663 106,112<br />
Depreciation and amortization 77,327 846 78,<strong>17</strong>3<br />
Impairment losses 19,598 20,544 40,142<br />
O<strong>the</strong>r non-cash expenses 78,810 ( 35,852 ) 42,958<br />
2010<br />
Revenues P 2,793,089 (P 83,311 ) P 2,709,778<br />
Net profit for <strong>the</strong> year 221,445 5,258 226,703<br />
Total assets <strong>17</strong>,870,773 ( 7,228,327 ) 10,642,446<br />
Total liabilities 4,971,031 ( 2,440,533) 2,530,498<br />
O<strong>the</strong>r segment information:<br />
Capital expenditures 56,611 190 56,801<br />
Depreciation and amortization 76,192 ( 603 ) 75,589<br />
Impairment losses 42,924 - 42,924<br />
O<strong>the</strong>r non-cash expenses ( 5,631 ) - ( 5,631)<br />
5. DISCONTINUED OPERATIONS<br />
As mentioned in Note 1.2, Kita and SLC (now OSSI – see Note 1.1) ceased <strong>the</strong><br />
operations of <strong>the</strong>ir plastic injection manufacturing business as of December 31, 2010.<br />
Termination benefits paid to employees who accepted voluntary redundancy amounted<br />
to P0.8 million in 2011 and P1.1 million in 2010 (see Note 22.1). The results of<br />
operations of <strong>the</strong> discontinued operations of <strong>the</strong> Group pertaining to <strong>the</strong> plastic<br />
injection manufacturing division are presented in <strong>the</strong> 2011 and 2010 con<strong>solid</strong>ated<br />
statements of <strong>inc</strong>ome under <strong>the</strong> Loss from Discontinued Operations account. There<br />
were no revenues generated and costs and expenses <strong>inc</strong>urred in 2012 from <strong>the</strong> Group’s<br />
discontinued operations.