SEC Form 17-A: Annual Report - the solid group inc website
SEC Form 17-A: Annual Report - the solid group inc website
SEC Form 17-A: Annual Report - the solid group inc website

Create successful ePaper yourself
Turn your PDF publications into a flip-book with our unique Google optimized e-Paper software.
43<br />
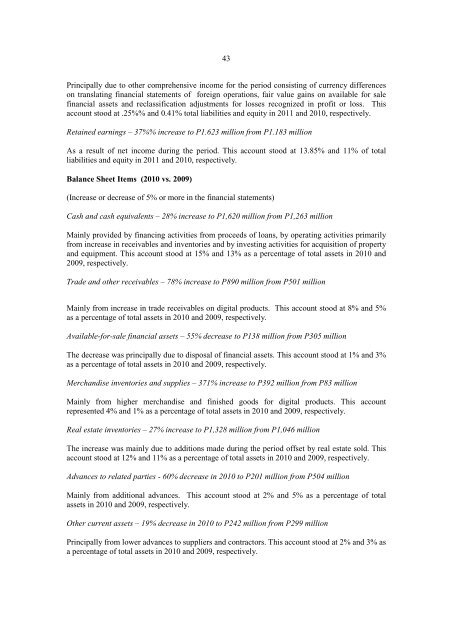
Pr<strong>inc</strong>ipally due to o<strong>the</strong>r comprehensive <strong>inc</strong>ome for <strong>the</strong> period consisting of currency differences<br />
on translating financial statements of foreign operations, fair value gains on available for sale<br />
financial assets and reclassification adjustments for losses recognized in profit or loss. This<br />
account stood at .25%% and 0.41% total liabilities and equity in 2011 and 2010, respectively.<br />
Retained earnings – 37%% <strong>inc</strong>rease to P1.623 million from P1.183 million<br />
As a result of net <strong>inc</strong>ome during <strong>the</strong> period. This account stood at 13.85% and 11% of total<br />
liabilities and equity in 2011 and 2010, respectively.<br />
Balance Sheet Items (2010 vs. 2009)<br />
(Increase or decrease of 5% or more in <strong>the</strong> financial statements)<br />
Cash and cash equivalents – 28% <strong>inc</strong>rease to P1,620 million from P1,263 million<br />
Mainly provided by financing activities from proceeds of loans, by operating activities primarily<br />
from <strong>inc</strong>rease in receivables and inventories and by investing activities for acquisition of property<br />
and equipment. This account stood at 15% and 13% as a percentage of total assets in 2010 and<br />
2009, respectively.<br />
Trade and o<strong>the</strong>r receivables – 78% <strong>inc</strong>rease to P890 million from P501 million<br />
Mainly from <strong>inc</strong>rease in trade receivables on digital products. This account stood at 8% and 5%<br />
as a percentage of total assets in 2010 and 2009, respectively.<br />
Available-for-sale financial assets – 55% decrease to P138 million from P305 million<br />
The decrease was pr<strong>inc</strong>ipally due to disposal of financial assets. This account stood at 1% and 3%<br />
as a percentage of total assets in 2010 and 2009, respectively.<br />
Merchandise inventories and supplies – 371% <strong>inc</strong>rease to P392 million from P83 million<br />
Mainly from higher merchandise and finished goods for digital products. This account<br />
represented 4% and 1% as a percentage of total assets in 2010 and 2009, respectively.<br />
Real estate inventories – 27% <strong>inc</strong>rease to P1,328 million from P1,046 million<br />
The <strong>inc</strong>rease was mainly due to additions made during <strong>the</strong> period offset by real estate sold. This<br />
account stood at 12% and 11% as a percentage of total assets in 2010 and 2009, respectively.<br />
Advances to related parties - 60% decrease in 2010 to P201 million from P504 million<br />
Mainly from additional advances. This account stood at 2% and 5% as a percentage of total<br />
assets in 2010 and 2009, respectively.<br />
O<strong>the</strong>r current assets – 19% decrease in 2010 to P242 million from P299 million<br />
Pr<strong>inc</strong>ipally from lower advances to suppliers and contractors. This account stood at 2% and 3% as<br />
a percentage of total assets in 2010 and 2009, respectively.