The Czech Republic Annual Report 2010 Drug ... - Drogy-info.cz
The Czech Republic Annual Report 2010 Drug ... - Drogy-info.cz
The Czech Republic Annual Report 2010 Drug ... - Drogy-info.cz

You also want an ePaper? Increase the reach of your titles
YUMPU automatically turns print PDFs into web optimized ePapers that Google loves.
Data on the clients of low-threshold facilities from other sources are also provided in the chapter on Data on Problem<br />
<strong>Drug</strong> Use from Non-Treatment Sources (p. 52).<br />
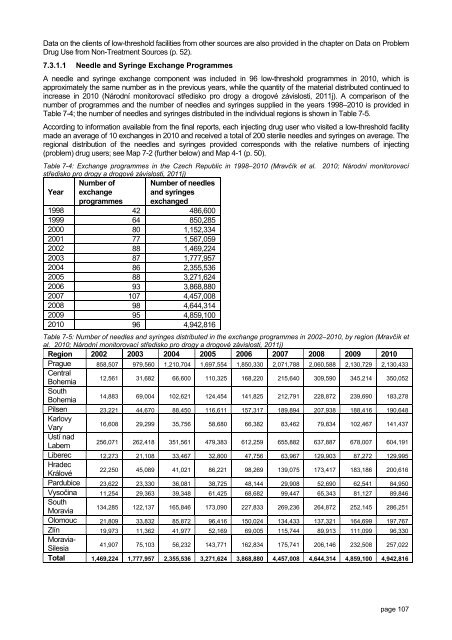
7.3.1.1 Needle and Syringe Exchange Programmes<br />
A needle and syringe exchange component was included in 96 low-threshold programmes in <strong>2010</strong>, which is<br />
approximately the same number as in the previous years, while the quantity of the material distributed continued to<br />
increase in <strong>2010</strong> (Národní monitorovací středisko pro drogy a drogové závislosti, 2011j). A comparison of the<br />
number of programmes and the number of needles and syringes supplied in the years 1998–<strong>2010</strong> is provided in<br />
Table 7-4; the number of needles and syringes distributed in the individual regions is shown in Table 7-5.<br />
According to <strong>info</strong>rmation available from the final reports, each injecting drug user who visited a low-threshold facility<br />
made an average of 10 exchanges in <strong>2010</strong> and received a total of 200 sterile needles and syringes on average. <strong>The</strong><br />
regional distribution of the needles and syringes provided corresponds with the relative numbers of injecting<br />
(problem) drug users; see Map 7-2 (further below) and Map 4-1 (p. 50).<br />
Table 7-4: Exchange programmes in the <strong>Czech</strong> <strong>Republic</strong> in 1998–<strong>2010</strong> (Mravčík et al. <strong>2010</strong>; Národní monitorovací<br />
středisko pro drogy a drogové závislosti, 2011j)<br />
Year<br />
Number of<br />
exchange<br />
programmes<br />
Number of needles<br />
and syringes<br />
exchanged<br />
1998 42 486,600<br />
1999 64 850,285<br />
2000 80 1,152,334<br />
2001 77 1,567,059<br />
2002 88 1,469,224<br />
2003 87 1,777,957<br />
2004 86 2,355,536<br />
2005 88 3,271,624<br />
2006 93 3,868,880<br />
2007 107 4,457,008<br />
2008 98 4,644,314<br />
2009 95 4,859,100<br />
<strong>2010</strong> 96 4,942,816<br />
Table 7-5: Number of needles and syringes distributed in the exchange programmes in 2002–<strong>2010</strong>, by region (Mravčík et<br />
al. <strong>2010</strong>; Národní monitorovací středisko pro drogy a drogové závislosti, 2011j)<br />
Region 2002 2003 2004 2005 2006 2007 2008 2009 <strong>2010</strong><br />
Prague 858,507 979,560 1,210,704 1,697,554 1,850,330 2,071,788 2,060,588 2,130,729 2,130,433<br />
Central<br />
Bohemia<br />
12,561 31,682 66,600 110,325 168,220 215,640 309,590 345,214 350,052<br />
South<br />
Bohemia<br />
14,883 69,004 102,621 124,454 141,825 212,791 228,872 239,690 183,278<br />
Pilsen 23,221 44,670 88,450 116,611 157,317 189,894 207,938 188,416 190,648<br />
Karlovy<br />
Vary<br />
Ústí nad<br />
Labem<br />
16,608 29,299 35,756 58,680 66,382 83,462 79,834 102,467 141,437<br />
256,071 262,418 351,561 479,383 612,259 655,882 637,887 678,007 604,191<br />
Liberec 12,273 21,108 33,467 32,800 47,756 63,967 129,903 87,272 129,995<br />
Hradec<br />
Králové<br />
22,250 45,089 41,021 86,221 98,269 139,075 173,417 183,186 200,616<br />
Pardubice 23,622 23,330 36,081 38,725 48,144 29,908 52,690 62,541 84,950<br />
Vysočina 11,254 29,363 39,348 61,425 68,682 99,447 65,343 81,127 89,846<br />
South<br />
Moravia<br />
134,285 122,137 165,846 173,090 227,833 269,236 264,872 252,145 286,251<br />
Olomouc 21,809 33,832 85,872 96,416 150,024 134,433 137,321 164,699 197,767<br />
Zlín 19,973 11,362 41,977 52,169 69,005 115,744 89,913 111,099 96,330<br />
Moravia-<br />
Silesia<br />
41,907 75,103 56,232 143,771 162,834 175,741 206,146 232,508 257,022<br />
Total 1,469,224 1,777,957 2,355,536 3,271,624 3,868,880 4,457,008 4,644,314 4,859,100 4,942,816<br />
page 107