The Czech Republic Annual Report 2010 Drug ... - Drogy-info.cz
The Czech Republic Annual Report 2010 Drug ... - Drogy-info.cz
The Czech Republic Annual Report 2010 Drug ... - Drogy-info.cz
You also want an ePaper? Increase the reach of your titles
YUMPU automatically turns print PDFs into web optimized ePapers that Google loves.
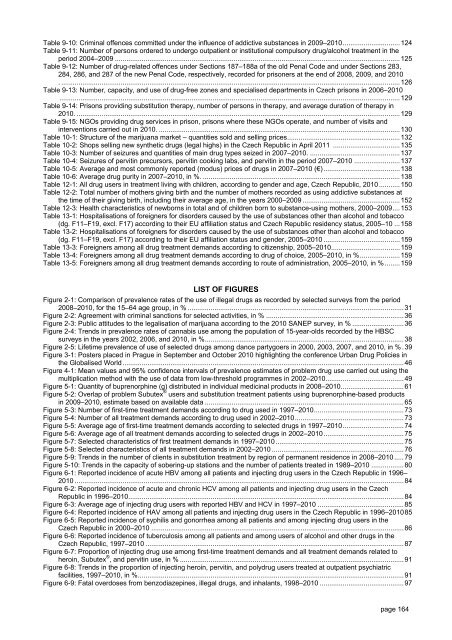
Table 9-10: Criminal offences committed under the influence of addictive substances in 2009–<strong>2010</strong>..............................124<br />
Table 9-11: Number of persons ordered to undergo outpatient or institutional compulsory drug/alcohol treatment in the<br />
period 2004–2009 .....................................................................................................................................................125<br />
Table 9-12: Number of drug-related offences under Sections 187–188a of the old Penal Code and under Sections 283,<br />
284, 286, and 287 of the new Penal Code, respectively, recorded for prisoners at the end of 2008, 2009, and <strong>2010</strong><br />
. .................................................................................................................................................................................126<br />
Table 9-13: Number, capacity, and use of drug-free zones and specialised departments in <strong>Czech</strong> prisons in 2006–<strong>2010</strong><br />
..................................................................................................................................................................................129<br />
Table 9-14: Prisons providing substitution therapy, number of persons in therapy, and average duration of therapy in<br />
<strong>2010</strong>. .........................................................................................................................................................................129<br />
Table 9-15: NGOs providing drug services in prison, prisons where these NGOs operate, and number of visits and<br />
interventions carried out in <strong>2010</strong>. ..............................................................................................................................130<br />
Table 10-1: Structure of the marijuana market – quantities sold and selling prices...........................................................132<br />
Table 10-2: Shops selling new synthetic drugs (legal highs) in the <strong>Czech</strong> <strong>Republic</strong> in April 2011 ...................................135<br />
Table 10-3: Number of seizures and quantities of main drug types seized in 2007–<strong>2010</strong>. ...............................................137<br />
Table 10-4: Seizures of pervitin precursors, pervitin cooking labs, and pervitin in the period 2007–<strong>2010</strong> ........................137<br />
Table 10-5: Average and most commonly reported (modus) prices of drugs in 2007–<strong>2010</strong> (€)........................................138<br />
Table 10-6: Average drug purity in 2007–<strong>2010</strong>, in %. .......................................................................................................138<br />
Table 12-1: All drug users in treatment living with children, according to gender and age, <strong>Czech</strong> <strong>Republic</strong>, <strong>2010</strong> ...........150<br />
Table 12-2: Total number of mothers giving birth and the number of mothers recorded as using addictive substances at<br />
the time of their giving birth, including their average age, in the years 2000–2009 ...................................................152<br />
Table 12-3: Health characteristics of newborns in total and of children born to substance-using mothers, 2000–2009....153<br />
Table 13-1: Hospitalisations of foreigners for disorders caused by the use of substances other than alcohol and tobacco<br />
(dg. F11–F19, excl. F17) according to their EU affiliation status and <strong>Czech</strong> <strong>Republic</strong> residency status, 2005–10 ...158<br />
Table 13-2: Hospitalisations of foreigners for disorders caused by the use of substances other than alcohol and tobacco<br />
(dg. F11–F19, excl. F17) according to their EU affiliation status and gender, 2005–<strong>2010</strong> ........................................159<br />
Table 13-3: Foreigners among all drug treatment demands according to citizenship, 2005–<strong>2010</strong>....................................159<br />
Table 13-4: Foreigners among all drug treatment demands according to drug of choice, 2005–<strong>2010</strong>, in %.....................159<br />
Table 13-5: Foreigners among all drug treatment demands according to route of administration, 2005–<strong>2010</strong>, in % ........159<br />
LIST OF FIGURES<br />
Figure 2-1: Comparison of prevalence rates of the use of illegal drugs as recorded by selected surveys from the period<br />
2008–<strong>2010</strong>, for the 15–64 age group, in % .................................................................................................................31<br />
Figure 2-2: Agreement with criminal sanctions for selected activities, in % ........................................................................36<br />
Figure 2-3: Public attitudes to the legalisation of marijuana according to the <strong>2010</strong> SANEP survey, in % ...........................36<br />
Figure 2-4: Trends in prevalence rates of cannabis use among the population of 15-year-olds recorded by the HBSC<br />
surveys in the years 2002, 2006, and <strong>2010</strong>, in %........................................................................................................38<br />
Figure 2-5: Lifetime prevalence of use of selected drugs among dance partygoers in 2000, 2003, 2007, and <strong>2010</strong>, in % .39<br />
Figure 3-1: Posters placed in Prague in September and October <strong>2010</strong> highlighting the conference Urban <strong>Drug</strong> Policies in<br />
the Globalised World...................................................................................................................................................46<br />
Figure 4-1: Mean values and 95% confidence intervals of prevalence estimates of problem drug use carried out using the<br />
multiplication method with the use of data from low-threshold programmes in 2002–<strong>2010</strong>.........................................49<br />
Figure 5-1: Quantity of buprenorphine (g) distributed in individual medicinal products in 2008–<strong>2010</strong>.................................61<br />
Figure 5-2: Overlap of problem Subutex ® users and substitution treatment patients using buprenorphine-based products<br />
in 2009–<strong>2010</strong>, estimate based on available data ........................................................................................................65<br />
Figure 5-3: Number of first-time treatment demands according to drug used in 1997–<strong>2010</strong>...............................................73<br />
Figure 5-4: Number of all treatment demands according to drug used in 2002–<strong>2010</strong>.........................................................73<br />
Figure 5-5: Average age of first-time treatment demands according to selected drugs in 1997–<strong>2010</strong>................................74<br />
Figure 5-6: Average age of all treatment demands according to selected drugs in 2002–<strong>2010</strong>..........................................75<br />
Figure 5-7: Selected characteristics of first treatment demands in 1997–<strong>2010</strong>...................................................................75<br />
Figure 5-8: Selected characteristics of all treatment demands in 2002–<strong>2010</strong> .....................................................................76<br />
Figure 5-9: Trends in the number of clients in substitution treatment by region of permanent residence in 2008–<strong>2010</strong> .....79<br />
Figure 5-10: Trends in the capacity of sobering-up stations and the number of patients treated in 1989–<strong>2010</strong> .................80<br />
Figure 6-1: <strong>Report</strong>ed incidence of acute HBV among all patients and injecting drug users in the <strong>Czech</strong> <strong>Republic</strong> in 1996–<br />
<strong>2010</strong> ............................................................................................................................................................................84<br />
Figure 6-2: <strong>Report</strong>ed incidence of acute and chronic HCV among all patients and injecting drug users in the <strong>Czech</strong><br />
<strong>Republic</strong> in 1996–<strong>2010</strong>................................................................................................................................................84<br />
Figure 6-3: Average age of injecting drug users with reported HBV and HCV in 1997–<strong>2010</strong> .............................................85<br />
Figure 6-4: <strong>Report</strong>ed incidence of HAV among all patients and injecting drug users in the <strong>Czech</strong> <strong>Republic</strong> in 1996–<strong>2010</strong>85<br />
Figure 6-5: <strong>Report</strong>ed incidence of syphilis and gonorrhea among all patients and among injecting drug users in the<br />
<strong>Czech</strong> <strong>Republic</strong> in 2000–<strong>2010</strong> ....................................................................................................................................86<br />
Figure 6-6: <strong>Report</strong>ed incidence of tuberculosis among all patients and among users of alcohol and other drugs in the<br />
<strong>Czech</strong> <strong>Republic</strong>, 1997–<strong>2010</strong> .......................................................................................................................................87<br />
Figure 6-7: Proportion of injecting drug use among first-time treatment demands and all treatment demands related to<br />
heroin, Subutex ® , and pervitin use, in % .....................................................................................................................91<br />
Figure 6-8: Trends in the proportion of injecting heroin, pervitin, and polydrug users treated at outpatient psychiatric<br />
facilities, 1997–<strong>2010</strong>, in %...........................................................................................................................................91<br />
Figure 6-9: Fatal overdoses from benzodiazepines, illegal drugs, and inhalants, 1998–<strong>2010</strong> ............................................97<br />
page 164


