The Czech Republic Annual Report 2010 Drug ... - Drogy-info.cz
The Czech Republic Annual Report 2010 Drug ... - Drogy-info.cz
The Czech Republic Annual Report 2010 Drug ... - Drogy-info.cz
You also want an ePaper? Increase the reach of your titles
YUMPU automatically turns print PDFs into web optimized ePapers that Google loves.
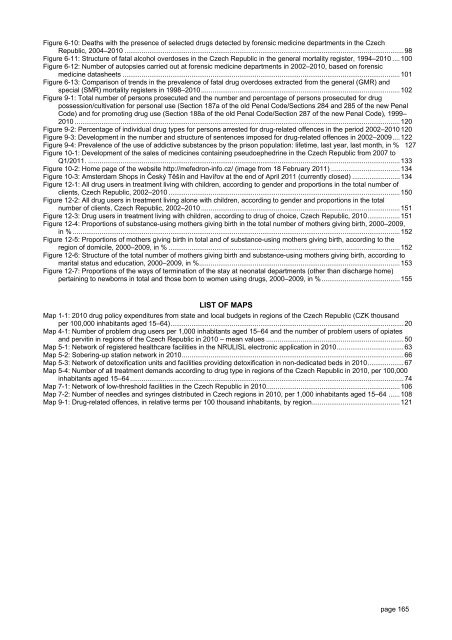
Figure 6-10: Deaths with the presence of selected drugs detected by forensic medicine departments in the <strong>Czech</strong><br />
<strong>Republic</strong>, 2004–<strong>2010</strong> ..................................................................................................................................................98<br />
Figure 6-11: Structure of fatal alcohol overdoses in the <strong>Czech</strong> <strong>Republic</strong> in the general mortality register, 1994–<strong>2010</strong> ....100<br />
Figure 6-12: Number of autopsies carried out at forensic medicine departments in 2002–<strong>2010</strong>, based on forensic<br />
medicine datasheets .................................................................................................................................................101<br />
Figure 6-13: Comparison of trends in the prevalence of fatal drug overdoses extracted from the general (GMR) and<br />
special (SMR) mortality registers in 1998–<strong>2010</strong>........................................................................................................102<br />
Figure 9-1: Total number of persons prosecuted and the number and percentage of persons prosecuted for drug<br />
possession/cultivation for personal use (Section 187a of the old Penal Code/Sections 284 and 285 of the new Penal<br />
Code) and for promoting drug use (Section 188a of the old Penal Code/Section 287 of the new Penal Code), 1999–<br />
<strong>2010</strong> ..........................................................................................................................................................................120<br />
Figure 9-2: Percentage of individual drug types for persons arrested for drug-related offences in the period 2002–<strong>2010</strong> 120<br />
Figure 9-3: Development in the number and structure of sentences imposed for drug-related offences in 2002–2009....122<br />
Figure 9-4: Prevalence of the use of addictive substances by the prison population: lifetime, last year, last month, in % 127<br />
Figure 10-1: Development of the sales of medicines containing pseudoephedrine in the <strong>Czech</strong> <strong>Republic</strong> from 2007 to<br />
Q1/2011. ...................................................................................................................................................................133<br />
Figure 10-2: Home page of the website http://mefedron-<strong>info</strong>.<strong>cz</strong>/ (image from 18 February 2011) ....................................134<br />
Figure 10-3: Amsterdam Shops in Český Těšín and Havířov at the end of April 2011 (currently closed) .........................134<br />
Figure 12-1: All drug users in treatment living with children, according to gender and proportions in the total number of<br />
clients, <strong>Czech</strong> <strong>Republic</strong>, 2002–<strong>2010</strong> .........................................................................................................................150<br />
Figure 12-2: All drug users in treatment living alone with children, according to gender and proportions in the total<br />
number of clients, <strong>Czech</strong> <strong>Republic</strong>, 2002–<strong>2010</strong> ........................................................................................................151<br />
Figure 12-3: <strong>Drug</strong> users in treatment living with children, according to drug of choice, <strong>Czech</strong> <strong>Republic</strong>, <strong>2010</strong>.................151<br />
Figure 12-4: Proportions of substance-using mothers giving birth in the total number of mothers giving birth, 2000–2009,<br />
in % ...........................................................................................................................................................................152<br />
Figure 12-5: Proportions of mothers giving birth in total and of substance-using mothers giving birth, according to the<br />
region of domicile, 2000–2009, in % .........................................................................................................................152<br />
Figure 12-6: Structure of the total number of mothers giving birth and substance-using mothers giving birth, according to<br />
marital status and education, 2000–2009, in %.........................................................................................................153<br />
Figure 12-7: Proportions of the ways of termination of the stay at neonatal departments (other than discharge home)<br />
pertaining to newborns in total and those born to women using drugs, 2000–2009, in %.........................................155<br />
LIST OF MAPS<br />
Map 1-1: <strong>2010</strong> drug policy expenditures from state and local budgets in regions of the <strong>Czech</strong> <strong>Republic</strong> (CZK thousand<br />
per 100,000 inhabitants aged 15–64)..........................................................................................................................20<br />
Map 4-1: Number of problem drug users per 1,000 inhabitants aged 15–64 and the number of problem users of opiates<br />
and pervitin in regions of the <strong>Czech</strong> <strong>Republic</strong> in <strong>2010</strong> – mean values ........................................................................50<br />
Map 5-1: Network of registered healthcare facilities in the NRULISL electronic application in <strong>2010</strong>...................................63<br />
Map 5-2: Sobering-up station network in <strong>2010</strong>....................................................................................................................66<br />
Map 5-3: Network of detoxification units and facilities providing detoxification in non-dedicated beds in <strong>2010</strong>...................67<br />
Map 5-4: Number of all treatment demands according to drug type in regions of the <strong>Czech</strong> <strong>Republic</strong> in <strong>2010</strong>, per 100,000<br />
inhabitants aged 15–64 ...............................................................................................................................................74<br />
Map 7-1: Network of low-threshold facilities in the <strong>Czech</strong> <strong>Republic</strong> in <strong>2010</strong>......................................................................106<br />
Map 7-2: Number of needles and syringes distributed in <strong>Czech</strong> regions in <strong>2010</strong>, per 1,000 inhabitants aged 15–64 ......108<br />
Map 9-1: <strong>Drug</strong>-related offences, in relative terms per 100 thousand inhabitants, by region..............................................121<br />
page 165


