The Czech Republic Annual Report 2010 Drug ... - Drogy-info.cz
The Czech Republic Annual Report 2010 Drug ... - Drogy-info.cz
The Czech Republic Annual Report 2010 Drug ... - Drogy-info.cz

You also want an ePaper? Increase the reach of your titles
YUMPU automatically turns print PDFs into web optimized ePapers that Google loves.
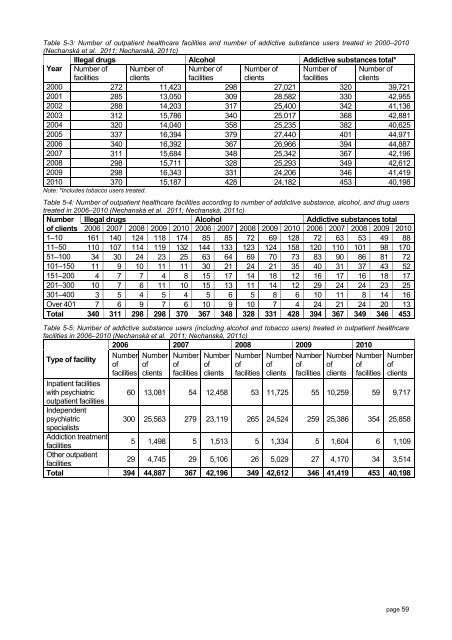
Table 5-3: Number of outpatient healthcare facilities and number of addictive substance users treated in 2000–<strong>2010</strong><br />
(Nechanská et al. 2011; Nechanská, 2011c)<br />
Illegal drugs Alcohol Addictive substances total*<br />
Year Number of<br />
facilities<br />
Number of<br />
clients<br />
Number of<br />
facilities<br />
Number of<br />
clients<br />
Number of<br />
facilities<br />
Number of<br />
clients<br />
2000 272 11,423 298 27,021 320 39,721<br />
2001 285 13,050 309 28,582 330 42,955<br />
2002 288 14,203 317 25,400 342 41,136<br />
2003 312 15,786 340 25,017 368 42,881<br />
2004 320 14,040 358 25,235 382 40,625<br />
2005 337 16,394 379 27,440 401 44,971<br />
2006 340 16,392 367 26,966 394 44,887<br />
2007 311 15,684 348 25,342 367 42,196<br />
2008 298 15,711 328 25,293 349 42,612<br />
2009 298 16,343 331 24,206 346 41,419<br />
<strong>2010</strong> 370 15,187 428 24,182 453 40,198<br />
Note: *Includes tobacco users treated.<br />
Table 5-4: Number of outpatient healthcare facilities according to number of addictive substance, alcohol, and drug users<br />
treated in 2006–<strong>2010</strong> (Nechanská et al. 2011; Nechanská, 2011c)<br />
Number Illegal drugs Alcohol Addictive substances total<br />
of clients 2006 2007 2008 2009 <strong>2010</strong> 2006 2007 2008 2009 <strong>2010</strong> 2006 2007 2008 2009 <strong>2010</strong><br />
1–10 161 140 124 118 174 85 85 72 69 128 72 63 53 49 88<br />
11–50 110 107 114 119 132 144 133 123 124 158 120 110 101 98 170<br />
51–100 34 30 24 23 25 63 64 69 70 73 83 90 86 81 72<br />
101–150 11 9 10 11 11 30 21 24 21 35 40 31 37 43 52<br />
151–200 4 7 7 4 8 15 17 14 18 12 16 17 16 18 17<br />
201–300 10 7 6 11 10 15 13 11 14 12 29 24 24 23 25<br />
301–400 3 5 4 5 4 5 6 5 8 6 10 11 8 14 16<br />
Over 401 7 6 9 7 6 10 9 10 7 4 24 21 24 20 13<br />
Total 340 311 298 298 370 367 348 328 331 428 394 367 349 346 453<br />
Table 5-5: Number of addictive substance users (including alcohol and tobacco users) treated in outpatient healthcare<br />
facilities in 2006–<strong>2010</strong> (Nechanská et al. 2011; Nechanská, 2011c)<br />
2006 2007 2008 2009 <strong>2010</strong><br />
Type of facility<br />
Number<br />
of<br />
facilities<br />
Number<br />
of<br />
clients<br />
Number<br />
of<br />
facilities<br />
Number<br />
of<br />
clients<br />
Number<br />
of<br />
facilities<br />
Number<br />
of<br />
clients<br />
Number<br />
of<br />
facilities<br />
Number<br />
of<br />
clients<br />
Number<br />
of<br />
facilities<br />
Number<br />
of<br />
clients<br />
Inpatient facilities<br />
with psychiatric 60 13,081 54 12,458 53 11,725 55 10,259 59 9,717<br />
outpatient facilities<br />
Independent<br />
psychiatric<br />
300 25,563 279 23,119 265 24,524 259 25,386 354 25,858<br />
specialists<br />
Addiction treatment<br />
facilities<br />
5 1,498 5 1,513 5 1,334 5 1,604 6 1,109<br />
Other outpatient<br />
facilities<br />
29 4,745 29 5,106 26 5,029 27 4,170 34 3,514<br />
Total 394 44,887 367 42,196 349 42,612 346 41,419 453 40,198<br />
page 59