The Czech Republic Annual Report 2010 Drug ... - Drogy-info.cz
The Czech Republic Annual Report 2010 Drug ... - Drogy-info.cz
The Czech Republic Annual Report 2010 Drug ... - Drogy-info.cz

Create successful ePaper yourself
Turn your PDF publications into a flip-book with our unique Google optimized e-Paper software.
egard to the year-on-year overlap of confidence intervals, there was a statistically significant decrease in the<br />
estimated total number of problem heroin users and an increase in the number of problem pervitin users. An<br />
overview of statistical significance of the changes in the estimated total number of problem drug users is provided in<br />
Figure 4-1 – there has been overlap in the confidence intervals of estimates from past years, meaning that the trend<br />
observed in mean estimate values must be interpreted with caution.<br />
Table 4-1: Mean values of prevalence estimates of problem drug use carried out using the multiplication method with the<br />
use of data from low-threshold programmes in 2002–<strong>2010</strong> (Mravčík et al. <strong>2010</strong>; Národní monitorovací středisko pro<br />
drogy a drogové závislosti, 2011d)<br />
Year<br />
Problem drug<br />
users in total<br />
Number<br />
Per 1,000<br />
people<br />
aged 15–<br />
64<br />
Problem users of opiates/opioids<br />
Heroin<br />
users<br />
Subutex ®<br />
users<br />
Total<br />
Total per<br />
1,000<br />
people<br />
aged 15–<br />
64<br />
Problem users<br />
of pervitin<br />
Number<br />
Per 1,000<br />
people<br />
aged 15–<br />
64<br />
Injecting drug<br />
users<br />
Number<br />
Per 1,000<br />
people<br />
aged 15–<br />
64<br />
2002 35,100 4.89 n.a. n.a. 13,300 1.85 21,800 3.04 31,700 4.41<br />
2003 29,000 4.02 n.a. n.a. 10,200 1.41 18,800 2.61 27,800 3.86<br />
2004 30,000 4.14 n.a. n.a. 9,700 1.34 20,300 2.80 27,000 3.73<br />
2005 31,800 4.37 n.a. n.a. 11,300 1.55 20,500 2.82 29,800 4.10<br />
2006 30,200 4.13 6,200 4,300 10,500 1.44 19,700 2.69 29,000 3.97<br />
2007 30,900 4.20 5,750 4,250 10,000 1.36 20,900 2.84 29,500 4.01<br />
2008 32,500 4.39 6,400 4,900 11,300 1.52 21,200 2.87 31,200 4.21<br />
2009 37,400 5.04 7,100 5,100 12,100 1.63 25,300 3.40 35,300 4.75<br />
<strong>2010</strong> 39,200 5.30 6,000 5,000 11,000 1.48 28,200 3.81 37,200 5.03<br />
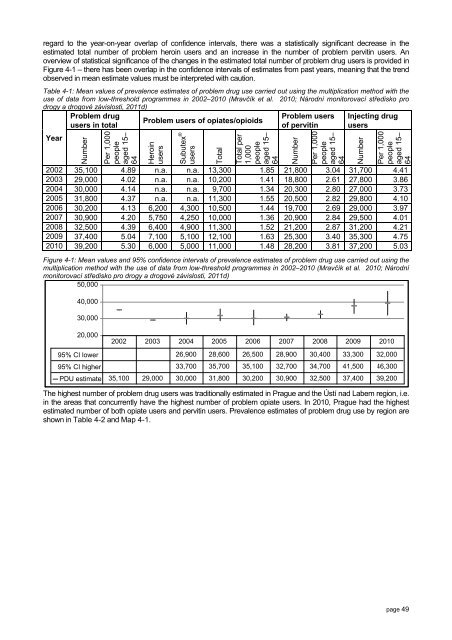
Figure 4-1: Mean values and 95% confidence intervals of prevalence estimates of problem drug use carried out using the<br />
multiplication method with the use of data from low-threshold programmes in 2002–<strong>2010</strong> (Mravčík et al. <strong>2010</strong>; Národní<br />
monitorovací středisko pro drogy a drogové závislosti, 2011d)<br />
<strong>The</strong> highest number of problem drug users was traditionally estimated in Prague and the Ústí nad Labem region, i.e.<br />
in the areas that concurrently have the highest number of problem opiate users. In <strong>2010</strong>, Prague had the highest<br />
estimated number of both opiate users and pervitin users. Prevalence estimates of problem drug use by region are<br />
shown in Table 4-2 and Map 4-1.<br />
page 49