

1A9bnbK
1A9bnbK
1A9bnbK

Create successful ePaper yourself
Turn your PDF publications into a flip-book with our unique Google optimized e-Paper software.
***<br />
THE DISEASES − CHAPTER 4<br />
133<br />
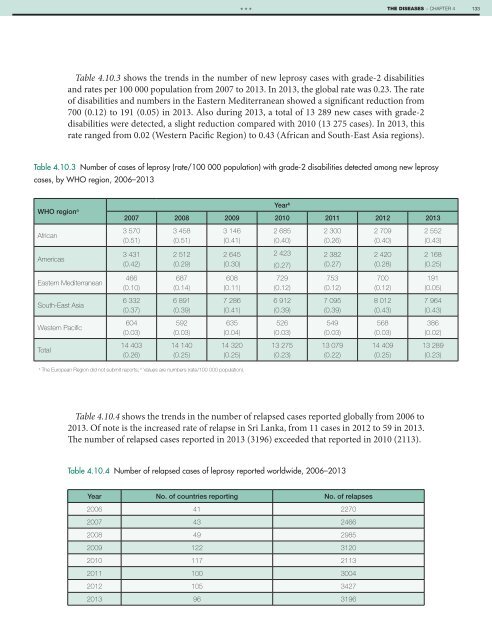
Table 4.10.3 shows the trends in the number of new leprosy cases with grade-2 disabilities<br />
and rates per 100 000 population from 2007 to 2013. In 2013, the global rate was 0.23. The rate<br />
of disabilities and numbers in the Eastern Mediterranean showed a significant reduction from<br />
700 (0.12) to 191 (0.05) in 2013. Also during 2013, a total of 13 289 new cases with grade-2<br />
disabilities were detected, a slight reduction compared with 2010 (13 275 cases). In 2013, this<br />
rate ranged from 0.02 (Western Pacific Region) to 0.43 (African and South-East Asia regions).<br />
Table 4.10.3 Number of cases of leprosy (rate/100 000 population) with grade-2 disabilities detected among new leprosy<br />
cases, by WHO region, 2006–2013<br />
WHO region a<br />
African<br />
Americas<br />
Eastern Mediterranean<br />
South-East Asia<br />
Western Pacifi c<br />
Total<br />
Year b<br />
2007 2008 2009 2010 2011 2012 2013<br />
3 570<br />
(0.51)<br />
3 431<br />
(0.42)<br />
466<br />
(0.10)<br />
6 332<br />
(0.37)<br />
604<br />
(0.03)<br />
14 403<br />
(0.26)<br />
3 458<br />
(0.51)<br />
2 512<br />
(0.29)<br />
687<br />
(0.14)<br />
6 891<br />
(0.39)<br />
592<br />
(0.03)<br />
14 140<br />
(0.25)<br />
3 146<br />
(0.41)<br />
2 645<br />
(0.30)<br />
608<br />
(0.11)<br />
7 286<br />
(0.41)<br />
635<br />
(0.04)<br />
14 320<br />
(0.25)<br />
2 685<br />
(0.40)<br />
2 423<br />
(0.27)<br />
729<br />
(0.12)<br />
6 912<br />
(0.39)<br />
526<br />
(0.03)<br />
13 275<br />
(0.23)<br />
2 300<br />
(0.26)<br />
2 382<br />
(0.27)<br />
753<br />
(0.12)<br />
7 095<br />
(0.39)<br />
549<br />
(0.03)<br />
13 079<br />
(0.22)<br />
2 709<br />
(0.40)<br />
2 420<br />
(0.28)<br />
700<br />
(0.12)<br />
8 012<br />
(0.43)<br />
568<br />
(0.03)<br />
14 409<br />
(0.25)<br />
2 552<br />
(0.43)<br />
2 168<br />
(0.25)<br />
191<br />
(0.05)<br />
7 964<br />
(0.43)<br />
386<br />
(0.02)<br />
13 289<br />
(0.23)<br />
a<br />
The European Region did not submit reports; b Values are numbers (rate/100 000 population).<br />
Table 4.10.4 shows the trends in the number of relapsed cases reported globally from 2006 to<br />
2013. Of note is the increased rate of relapse in Sri Lanka, from 11 cases in 2012 to 59 in 2013.<br />
The number of relapsed cases reported in 2013 (3196) exceeded that reported in 2010 (2113).<br />
Table 4.10.4 Number of relapsed cases of leprosy reported worldwide, 2006–2013<br />
Year No. of countries reporting No. of relapses<br />
2006 41 2270<br />
2007 43 2466<br />
2008 49 2985<br />
2009 122 3120<br />
2010 117 2113<br />
2011 100 3004<br />
2012 105 3427<br />
2013 96 3196