Kentucky Coal Facts - 13th Edition - Department for Energy ...
Kentucky Coal Facts - 13th Edition - Department for Energy ...
Kentucky Coal Facts - 13th Edition - Department for Energy ...

Create successful ePaper yourself
Turn your PDF publications into a flip-book with our unique Google optimized e-Paper software.
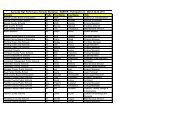
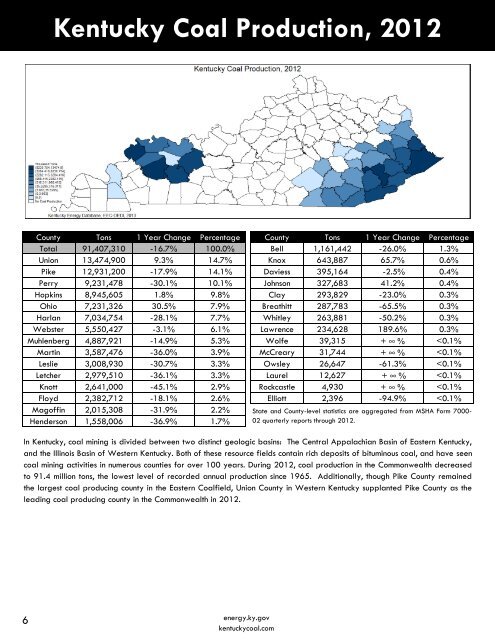
<strong>Kentucky</strong> <strong>Coal</strong> Production, 2012<br />
County Tons 1 Year Change Percentage<br />
Total 91,407,310 -16.7% 100.0%<br />
Union 13,474,900 9.3% 14.7%<br />
Pike 12,931,200 -17.9% 14.1%<br />
Perry 9,231,478 -30.1% 10.1%<br />
Hopkins 8,945,605 1.8% 9.8%<br />
Ohio 7,231,326 30.5% 7.9%<br />
Harlan 7,034,754 -28.1% 7.7%<br />
Webster 5,550,427 -3.1% 6.1%<br />
Muhlenberg 4,887,921 -14.9% 5.3%<br />
Martin 3,587,476 -36.0% 3.9%<br />
Leslie 3,008,930 -30.7% 3.3%<br />
Letcher 2,979,510 -36.1% 3.3%<br />
Knott 2,641,000 -45.1% 2.9%<br />
Floyd 2,382,712 -18.1% 2.6%<br />
Magoffin 2,015,308 -31.9% 2.2%<br />
Henderson 1,558,006 -36.9% 1.7%<br />
County Tons 1 Year Change Percentage<br />
Bell 1,161,442 -26.0% 1.3%<br />
Knox 643,887 65.7% 0.6%<br />
Daviess 395,164 -2.5% 0.4%<br />
Johnson 327,683 41.2% 0.4%<br />
Clay 293,829 -23.0% 0.3%<br />
Breathitt 287,783 -65.5% 0.3%<br />
Whitley 263,881 -50.2% 0.3%<br />
Lawrence 234,628 189.6% 0.3%<br />
Wolfe 39,315 + ∞ %