Kentucky Coal Facts - 13th Edition - Department for Energy ...
Kentucky Coal Facts - 13th Edition - Department for Energy ...
Kentucky Coal Facts - 13th Edition - Department for Energy ...

You also want an ePaper? Increase the reach of your titles
YUMPU automatically turns print PDFs into web optimized ePapers that Google loves.
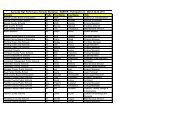
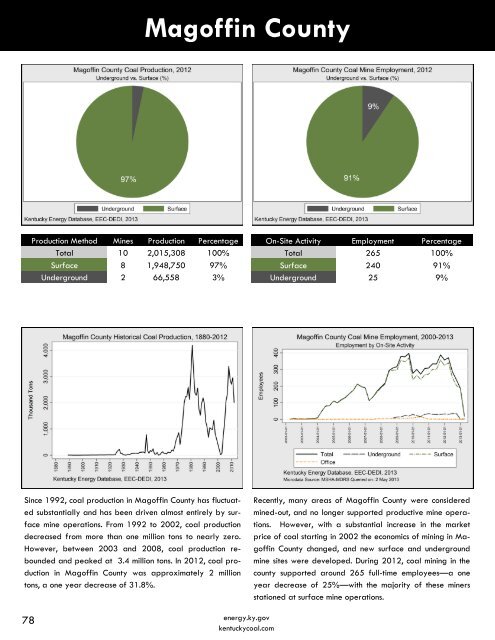
Magoffin County<br />
Production Method Mines Production Percentage<br />
Total 10 2,015,308 100%<br />
Surface 8 1,948,750 97%<br />
Underground 2 66,558 3%<br />
On-Site Activity Employment Percentage<br />
Total 265 100%<br />
Surface 240 91%<br />
Underground 25 9%<br />
Since 1992, coal production in Magoffin County has fluctuated<br />
substantially and has been driven almost entirely by surface<br />
mine operations. From 1992 to 2002, coal production<br />
decreased from more than one million tons to nearly zero.<br />
However, between 2003 and 2008, coal production rebounded<br />
and peaked at 3.4 million tons. In 2012, coal production<br />
in Magoffin County was approximately 2 million<br />
tons, a one year decrease of 31.8%.<br />
Recently, many areas of Magoffin County were considered<br />
mined-out, and no longer supported productive mine operations.<br />
However, with a substantial increase in the market<br />
price of coal starting in 2002 the economics of mining in Magoffin<br />
County changed, and new surface and underground<br />
mine sites were developed. During 2012, coal mining in the<br />
county supported around 265 full-time employees—a one<br />
year decrease of 25%—with the majority of these miners<br />
stationed at surface mine operations.<br />
78<br />
energy.ky.gov<br />
kentuckycoal.com