Kentucky Coal Facts - 13th Edition - Department for Energy ...
Kentucky Coal Facts - 13th Edition - Department for Energy ...
Kentucky Coal Facts - 13th Edition - Department for Energy ...

Create successful ePaper yourself
Turn your PDF publications into a flip-book with our unique Google optimized e-Paper software.
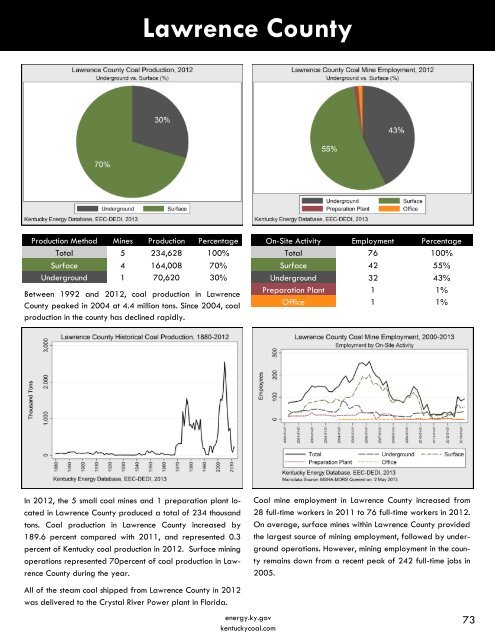
Lawrence County<br />
Production Method Mines Production Percentage<br />
Total 5 234,628 100%<br />
Surface 4 164,008 70%<br />
Underground 1 70,620 30%<br />
Between 1992 and 2012, coal production in Lawrence<br />
County peaked in 2004 at 4.4 million tons. Since 2004, coal<br />
production in the county has declined rapidly.<br />
On-Site Activity Employment Percentage<br />
Total 76 100%<br />
Surface 42 55%<br />
Underground 32 43%<br />
Preparation Plant 1 1%<br />
Office 1 1%<br />
In 2012, the 5 small coal mines and 1 preparation plant located<br />
in Lawrence County produced a total of 234 thousand<br />
tons. <strong>Coal</strong> production in Lawrence County increased by<br />
189.6 percent compared with 2011, and represented 0.3<br />
percent of <strong>Kentucky</strong> coal production in 2012. Surface mining<br />
operations represented 70percent of coal production in Lawrence<br />
County during the year.<br />
<strong>Coal</strong> mine employment in Lawrence County increased from<br />
28 full-time workers in 2011 to 76 full-time workers in 2012.<br />
On average, surface mines within Lawrence County provided<br />
the largest source of mining employment, followed by underground<br />
operations. However, mining employment in the county<br />
remains down from a recent peak of 242 full-time jobs in<br />
2005.<br />
All of the steam coal shipped from Lawrence County in 2012<br />
was delivered to the Crystal River Power plant in Florida.<br />
energy.ky.gov<br />
kentuckycoal.com<br />
73