Kentucky Coal Facts - 13th Edition - Department for Energy ...
Kentucky Coal Facts - 13th Edition - Department for Energy ...
Kentucky Coal Facts - 13th Edition - Department for Energy ...

Create successful ePaper yourself
Turn your PDF publications into a flip-book with our unique Google optimized e-Paper software.
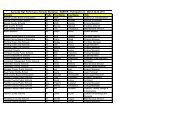
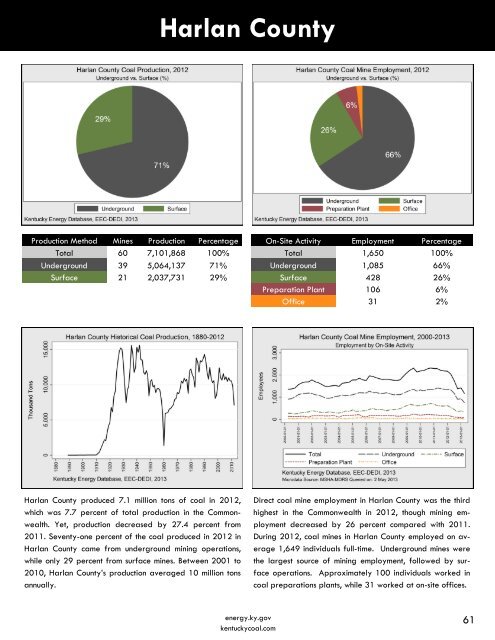
Harlan County<br />
Production Method Mines Production Percentage<br />
Total 60 7,101,868 100%<br />
Underground 39 5,064,137 71%<br />
Surface 21 2,037,731 29%<br />
On-Site Activity Employment Percentage<br />
Total 1,650 100%<br />
Underground 1,085 66%<br />
Surface 428 26%<br />
Preparation Plant 106 6%<br />
Office 31 2%<br />
Harlan County produced 7.1 million tons of coal in 2012,<br />
which was 7.7 percent of total production in the Commonwealth.<br />
Yet, production decreased by 27.4 percent from<br />
2011. Seventy-one percent of the coal produced in 2012 in<br />
Harlan County came from underground mining operations,<br />
while only 29 percent from surface mines. Between 2001 to<br />
2010, Harlan County’s production averaged 10 million tons<br />
annually.<br />
Direct coal mine employment in Harlan County was the third<br />
highest in the Commonwealth in 2012, though mining employment<br />
decreased by 26 percent compared with 2011.<br />
During 2012, coal mines in Harlan County employed on average<br />
1,649 individuals full-time. Underground mines were<br />
the largest source of mining employment, followed by surface<br />
operations. Approximately 100 individuals worked in<br />
coal preparations plants, while 31 worked at on-site offices.<br />
energy.ky.gov<br />
kentuckycoal.com<br />
61