Interim Report - TEEB
Interim Report - TEEB
Interim Report - TEEB
You also want an ePaper? Increase the reach of your titles
YUMPU automatically turns print PDFs into web optimized ePapers that Google loves.
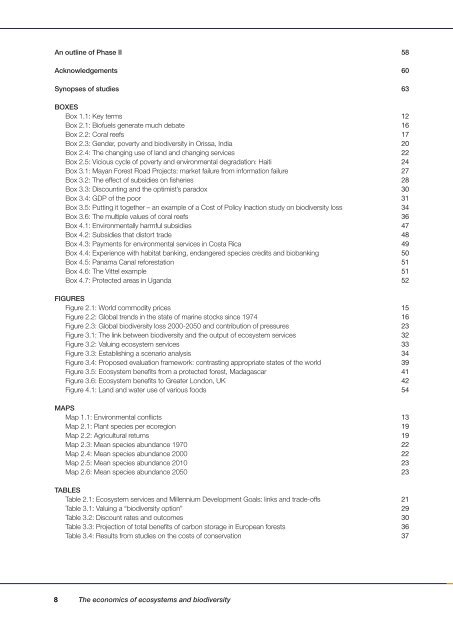
An outline of Phase II 58<br />
Acknowledgements 60<br />
Synopses of studies 63<br />
BOXES<br />
Box 1.1: Key terms 12<br />
Box 2.1: Biofuels generate much debate 16<br />
Box 2.2: Coral reefs 17<br />
Box 2.3: Gender, poverty and biodiversity in Orissa, India 20<br />
Box 2.4: The changing use of land and changing services 22<br />
Box 2.5: Vicious cycle of poverty and environmental degradation: Haiti 24<br />
Box 3.1: Mayan Forest Road Projects: market failure from information failure 27<br />
Box 3.2: The effect of subsidies on fisheries 28<br />
Box 3.3: Discounting and the optimist’s paradox 30<br />
Box 3.4: GDP of the poor 31<br />
Box 3.5: Putting it together – an example of a Cost of Policy Inaction study on biodiversity loss 34<br />
Box 3.6: The multiple values of coral reefs 36<br />
Box 4.1: Environmentally harmful subsidies 47<br />
Box 4.2: Subsidies that distort trade 48<br />
Box 4.3: Payments for environmental services in Costa Rica 49<br />
Box 4.4: Experience with habitat banking, endangered species credits and biobanking 50<br />
Box 4.5: Panama Canal reforestation 51<br />
Box 4.6: The Vittel example 51<br />
Box 4.7: Protected areas in Uganda 52<br />
FIGURES<br />
Figure 2.1: World commodity prices 15<br />
Figure 2.2: Global trends in the state of marine stocks since 1974 16<br />
Figure 2.3: Global biodiversity loss 2000-2050 and contribution of pressures 23<br />
Figure 3.1: The link between biodiversity and the output of ecosystem services 32<br />
Figure 3.2: Valuing ecosystem services 33<br />
Figure 3.3: Establishing a scenario analysis 34<br />
Figure 3.4: Proposed evaluation framework: contrasting appropriate states of the world 39<br />
Figure 3.5: Ecosystem benefits from a protected forest, Madagascar 41<br />
Figure 3.6: Ecosystem benefits to Greater London, UK 42<br />
Figure 4.1: Land and water use of various foods 54<br />
MAPS<br />
Map 1.1: Environmental conflicts 13<br />
Map 2.1: Plant species per ecoregion 19<br />
Map 2.2: Agricultural returns 19<br />
Map 2.3: Mean species abundance 1970 22<br />
Map 2.4: Mean species abundance 2000 22<br />
Map 2.5: Mean species abundance 2010 23<br />
Map 2.6: Mean species abundance 2050 23<br />
TABLES<br />
Table 2.1: Ecosystem services and Millennium Development Goals: links and trade-offs 21<br />
Table 3.1: Valuing a “biodiversity option” 29<br />
Table 3.2: Discount rates and outcomes 30<br />
Table 3.3: Projection of total benefits of carbon storage in European forests 36<br />
Table 3.4: Results from studies on the costs of conservation 37<br />
8 The economics of ecosystems and biodiversity


