Interim Report - TEEB
Interim Report - TEEB
Interim Report - TEEB

Create successful ePaper yourself
Turn your PDF publications into a flip-book with our unique Google optimized e-Paper software.
value of the watershed protection provided by intact coastal<br />
ecosystems, such as mangroves and other wetlands, has<br />
been estimated at US$ 845 per hectare per year in Malaysia<br />
and US$ 1,022 per hectare per year in Hawaii, United States<br />
of America. Overall, the values of the multiple watershed<br />
services tend to range from US$ 200 to 1,000 per hectare<br />
per year (Mullan and Kontoleon 2008). The value of bee<br />
pollination for coffee production has been estimated at US$<br />
361 per hectare per year (Ricketts et al. 2004), although the<br />
benefits only accrued to producers within 1 kilometre of<br />
natural forests. Many of the studies evaluating regulating<br />
services, for example for coastal protection or regulation of<br />
the water cycle, use production function approaches. These<br />
approaches are being increasingly refined, allowing better<br />
assessment of trade-offs between competing uses of<br />
ecosystems (see, for example, Barbier et al. 2008).<br />
While there is increasing evidence of the value of some<br />
regulating services, many others, such as health regulation,<br />
have been little explored so far, although there are some<br />
indications that they might be significant (Pattanayak and<br />
Wendland 2007).<br />
The economic importance of the contribution of aggregated<br />
biodiversity to ecosystem resilience (the capacity of an<br />
ecosystem to absorb shocks and stresses in constructive<br />
ways) is probably very high but still poorly quantified, although<br />
studies have analysed aspects such as the contribution of<br />
crop diversity to agricultural yields and farm income (e.g. Di<br />
Falco and Perrings 2005, Birol et al. 2005). This important<br />
gap in knowledge reflects the difficulty of first quantifying the<br />
risks of a system collapse from an ecological perspective,<br />
and then measuring people’s willingness to pay to reduce<br />
those risks which are not yet well understood.<br />
The real costs of the loss of biodiversity and ecosystems<br />
also include option values. Although they are difficult to<br />
measure, these values placed on conserving resources for<br />
possible uses in the future are significant because our<br />
knowledge of the importance of ecosystem services is<br />
expected to improve over time, and because part of the<br />
losses of biodiversity and the services it underpins are<br />
irreversible. A preferred methodology for measuring option<br />
values (in particular, bio-prospecting values) has been<br />
prepared as part of the preparatory work in Phase I<br />
(Gundimeda 2008). In Phase II, we propose to build on<br />
this approach.<br />
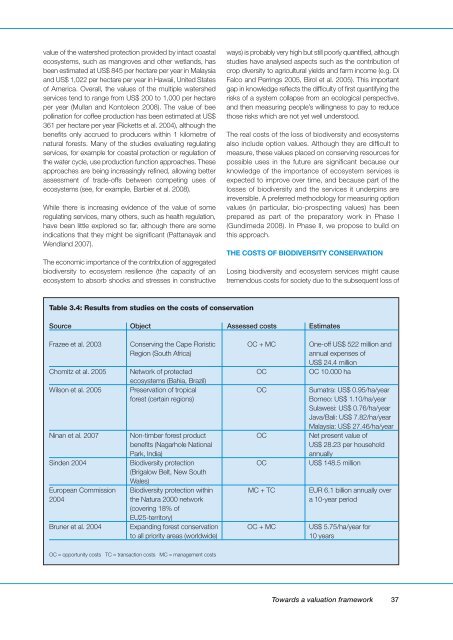
THE COSTS OF BIODIVERSITY CONSERVATION<br />
Losing biodiversity and ecosystem services might cause<br />
tremendous costs for society due to the subsequent loss of<br />
Table 3.4: Results from studies on the costs of conservation<br />
Source Object Assessed costs Estimates<br />
Frazee et al. 2003 Conserving the Cape Floristic OC + MC One-off US$ 522 million and<br />
Region (South Africa)<br />
annual expenses of<br />
US$ 24.4 million<br />
Chomitz et al. 2005 Network of protected OC OC 10.000 ha<br />
ecosystems (Bahia, Brazil)<br />
Wilson et al. 2005 Preservation of tropical OC Sumatra: US$ 0.95/ha/year<br />
forest (certain regions)<br />
Borneo: US$ 1.10/ha/year<br />
Sulawesi: US$ 0.76/ha/year<br />
Java/Bali: US$ 7.82/ha/year<br />
Malaysia: US$ 27.46/ha/year<br />
Ninan et al. 2007 Non-timber forest product OC Net present value of<br />
benefits (Nagarhole National<br />
US$ 28.23 per household<br />
Park, India)<br />
annually<br />
Sinden 2004 Biodiversity protection OC US$ 148.5 million<br />
(Brigalow Belt, New South<br />
Wales)<br />
European Commission Biodiversity protection within MC + TC EUR 6.1 billion annually over<br />
2004 the Natura 2000 network a 10-year period<br />
(covering 18% of<br />
EU25-territory)<br />
Bruner et al. 2004 Expanding forest conservation OC + MC US$ 5.75/ha/year for<br />
to all priority areas (worldwide)<br />
10 years<br />
OC = opportunity costs TC = transaction costs MC = management costs<br />
Towards a valuation framework<br />
37